Chutes and Ladders
With Chairman Powell’s testimony marking another message of “data dependency,” I can’t help but feel like every data point either sends the market down a chute or helps it climb a tiny rung on the ladder. Given our careful watch on every data point, I thought it might be useful to highlight a couple of things that are new, whether because they’ve changed direction or because they’re signaling something with a louder horn than before. And when I say new, I mean within the last week. A few of the things that have changed are: fed funds rate expectations, the depth of the 2-year/10-year yield curve inversion, and job openings in the construction sector.Red Light, Green Light
I remember playing the game red light, green light as a kid, and despite its simplicity it was always fun because of the unpredictability and suspense. You had to be quick to react — and even a second of hesitation meant you probably didn’t win. Unfortunately, we’re in a market environment where every data point feels that way. The most recent market-moving event was Fed Chair Powell’s testimony to Congress, which sent fed funds futures (the market’s expectation for where the fed funds rate will be) up in quick fashion. Red light. We thought we had downshifted to only 25 basis point hikes from here on out, signaling not only that the Fed had a grasp on the pace and size of tightening, but also that it was working to bring inflation down and cool off overheated parts of the economy. The message we got instead was that hikes may now increase back to 50 basis points — if warranted by hot econ data. What ensued (so far) has been a market sell-off as investors digested a possible jagged rate path. Moreover, the news pushed the 2-year Treasury yield up over 5% and caused an erratic reaction in the 10-year Treasury yield. The result was an inversion between the 2s/10s of more than 100 bps, a level we haven’t seen since the early 1980s. There are differing views on how predictive yield curve inversions are, and I can understand their muted importance as a signal at shallow and brief inversions, but crossing over the 100 basis point level is a pretty loud alarm, IMO. Red light.Operation
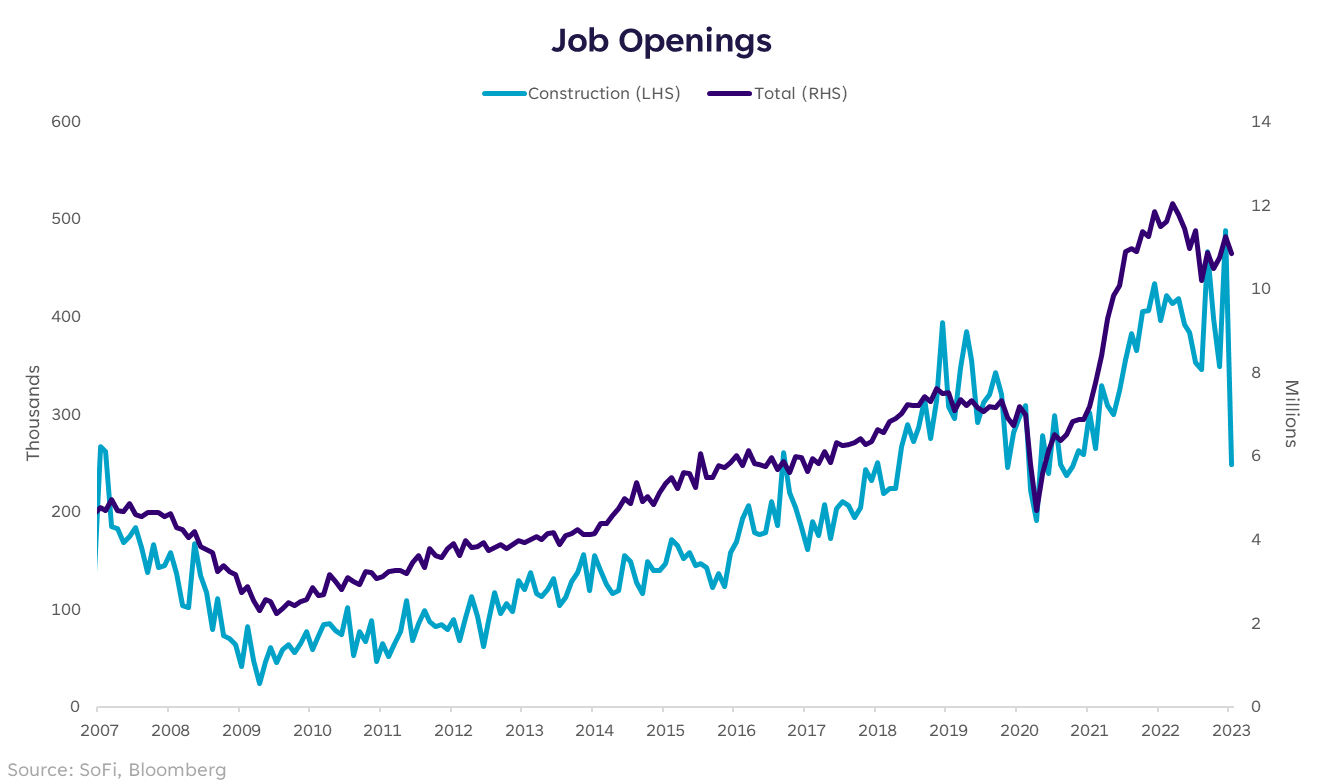
I did not like the game of operation because it left so little margin for error. The good news was even if you got buzzed, you still got another chance. This data point is more of a buzz along the way, but one we should watch closely. The JOLTS data (a.k.a. Job Openings) came in slightly weaker than last month (10.8 mil vs. 11.2 mil), but remained high and indicates the labor market is still tight. To be specific, the gap between unemployed people and jobs open is still 5.1 million. Digging deeper into the data though, the sector in January’s report that sticks out like a sore thumb is construction job openings. Month-over-month, job openings in construction are down 49%. They’ve been erratic in recent months, but this move is bigger than the ones before. Much of this is likely due to softening in the housing market and less backlog of homes being built. Although the weaker housing market isn’t new news, the reason construction employment is important to watch is because it tends to be a decent leading indicator for the broad labor market. Nothing more than a warning zap? Perhaps. For now, it’s simply a notable shift that I don’t want to overlook. But when we add it to recent announcements of commercial real estate defaults, and knowing that the residential real estate market is in somewhat of a holding pattern, it feels like a yellow light, at least. In closing, although none of these data points in isolation directly signal impending doom, they do add to the list of things that keep me up at night. Despite my cautious tone, I won’t entirely count out a positive surprise and some sort of “drawdown averted” scenario. I just continue to see more evidence against it.
Please understand that this information provided is general in nature and shouldn’t be construed as a recommendation or solicitation of any products offered by SoFi’s affiliates and subsidiaries. In addition, this information is by no means meant to provide investment or financial advice, nor is it intended to serve as the basis for any investment decision or recommendation to buy or sell any asset. Keep in mind that investing involves risk, and past performance of an asset never guarantees future results or returns. It’s important for investors to consider their specific financial needs, goals, and risk profile before making an investment decision. The information and analysis provided through hyperlinks to third party websites, while believed to be accurate, cannot be guaranteed by SoFi. These links are provided for informational purposes and should not be viewed as an endorsement. No brands or products mentioned are affiliated with SoFi, nor do they endorse or sponsor this content. Communication of SoFi Wealth LLC an SEC Registered Investment Advisor SoFi isn't recommending and is not affiliated with the brands or companies displayed. Brands displayed neither endorse or sponsor this article. Third party trademarks and service marks referenced are property of their respective owners. Communication of SoFi Wealth LLC an SEC Registered Investment Adviser. Information about SoFi Wealth’s advisory operations, services, and fees is set forth in SoFi Wealth’s current Form ADV Part 2 (Brochure), a copy of which is available upon request and at www.adviserinfo.sec.gov. Liz Young Thomas is a Registered Representative of SoFi Securities and Investment Advisor Representative of SoFi Wealth. Her ADV 2B is available at www.sofi.com/legal/adv. SOSS23030903


