Being a train conductor allows you to take people and essential goods where they need to go, see the country, and get paid while doing it. In fact, a competitive salary is often one of the big draws of the field. But just how much does a train conductor make? According to the U.S. Bureau of Labor Statistics (BLS), the median annual wage for a train conductor is $72,220.
If that salary sounds appealing, keep reading to learn what train conductors do, how much they stand to make in different states, and the pros and cons of the job.
• The median annual wage for a train conductor is $72,220.
• Salaries for train conductors vary by state, ranging from $57,450 to $82,530.
• Train conductors receive health, dental, vision insurance, and a retirement savings plan.
• Minimal educational requirements and job training provided by employers are advantages.
• Challenges include federal licensure, physically demanding work, and irregular scheduling.
What Is a Train Conductor?
If you’ve ever dreamed of yelling “all aboard” and taking the wheel of a train, then you may find satisfaction as a train conductor. This type of trade job is responsible for organizing and overseeing various activities within a railroad yard, industrial plant, or similar locations. They play a vital role in coordinating the actions of the train crew, whether on passenger trains or freight trains. Additionally, yardmasters take charge of reviewing train schedules and switching orders while ensuring smooth coordination among workers involved in railroad traffic operations, including train assembly, disassembly, and yard switching tasks.
Working as a train conductor can be stressful and requires attention to detail. However, introverts may find that they love this job as it requires minimum interactions with other people.
Check your score with SoFi
Track your credit score for free. Sign up and get $10.*
How much money does a train conductor make? According to the latest BLS data, annual salaries range from a low of $54,610, which is most likely what entry-level conductors earn, all the way up to $99,210 or more. As workers gain more years of experience, they can expect to see their salary increase. At the very least, they should always expect to make the minimum wage in their state.
No matter your income, online tools make tracking your spending easy. You can easily set up budgets, then get instant updates on your progress, spot upcoming bills, analyze your spending habits, and more.
What Is the Average Salary for a Train Conductor?
While most people don’t focus their job search on trying to find the highest-paying job in their state, it’s a good idea to do salary research before pursuing a new career path.
So how much does a train conductor make per hour? Typically, train conductors earn a median hourly wage of $34.20, according to the BLS but that rate differs by state. Take a look at the following table to get an idea of what train conductors can earn in different states.
Most train conductors work full time and are eligible for employer benefits on top of their salary. Benefits like health insurance and paid time off can be valuable and increase the overall value of a compensation package.
Savvy employers know that alongside offering a competitive salary, a robust benefits package can attract and retain top talent. Common employee benefits that train conductors may expect to see include:
Like any job, working as a train conductor comes with a unique set of advantages and disadvantages that are worth being aware of.
Pros
• Minimal educational requirements, making it accessible to a broader range of individuals
• Job training is provided by employers, allowing for on-the-job skill development
• Regular rest hours are enforced, ensuring a reasonable work-life balance
Cons
• Federal licensure requirements add an additional step to the process
• The job can be physically demanding, especially in challenging weather conditions
• Work weeks may extend beyond the standard 40 hours, leading to potential overtime hours
• Irregular scheduling is common, which can make it challenging to maintain a consistent routine
The Takeaway
Considering a job as a train conductor? Though rewarding, this line of work is also high stakes, and anyone considering this career path needs to be prepared to take the responsibility seriously. It’s also important to understand what the position typically pays and what your earning potential could be. The median annual salary train conductors earn is $72,220, but train conductors with many years of experience can expect to earn more than this.
Take control of your finances with SoFi. With our financial insights and credit score monitoring tools, you can view all of your accounts in one convenient dashboard. From there, you can see your various balances, spending breakdowns, and credit score. Plus you can easily set up budgets and discover valuable financial insights — all at no cost.
See exactly how your money comes and goes at a glance.
FAQ
What is the highest paying railroad job?
If someone is looking to make the most money possible as a train conductor, they may want to consider working for their state government. According to BLS data, train conductors who work for state governments earn a median salary of $80,970 per year.
Do train conductors make six figures?
How much does a train conductor make per year, and can they earn a six-figure salary? The good news is that it is possible to earn six figures as a train conductor. While the average train conductor earns a median salary of $72,220, train conductors employed by state governments earn a median of $80,970 each year.
What is the average age for a train conductor?
Many people find fulfilling careers as train conductors at all different ages. That said, the average age for a train conductor is 42.
About the author
Jacqueline DeMarco
Jacqueline DeMarco is a freelance writer who specializes in financial topics. Her first job out of college was in the financial industry, and it was there she gained a passion for helping others understand tricky financial topics. Read full bio.
Photo credit: iStock/Laser1987
SoFi Relay offers users the ability to connect both SoFi accounts and external accounts using Plaid, Inc.’s service. When you use the service to connect an account, you authorize SoFi to obtain account information from any external accounts as set forth in SoFi’s Terms of Use. Based on your consent SoFi will also automatically provide some financial data received from the credit bureau for your visibility, without the need of you connecting additional accounts. SoFi assumes no responsibility for the timeliness, accuracy, deletion, non-delivery or failure to store any user data, loss of user data, communications, or personalization settings. You shall confirm the accuracy of Plaid data through sources independent of SoFi. The credit score is a VantageScore® based on TransUnion® (the “Processing Agent”) data.
Non affiliation: SoFi isn’t affiliated with any of the companies highlighted in this article.
Financial Tips & Strategies: The tips provided on this website are of a general nature and do not take into account your specific objectives, financial situation, and needs. You should always consider their appropriateness given your own circumstances.
Lifestyle creep is defined as spending more as you earn more. Perhaps you’ve noticed that as your income rises, you may not grow your wealth, including your retirement account or that fund for the down payment on a house.
It may well be human nature that, when you get a salary hike, you decide to splash out on a fancier car lease, a bigger home, or a luxurious vacation. However, your spending may actually be outpacing your salary and even ringing up more credit card debt.
That’s lifestyle creep in action: Spending on “fun” non-essentials instead of putting that money to work for a more stable financial future. Learn more about it and how to rein it in while still enjoying the things money can buy.
Key Points
• Lifestyle creep involves increasing non-essential spending as income grows, impacting financial goals.
• Signals of lifestyle creep can include not saving more despite higher earnings, abandoning budgeting, and rising credit card debt.
• Social and psychological pressures, like keeping up with peers, can cause lifestyle creep.
• Managing lifestyle creep effectively involves creating a budget for savings, debt, and discretionary spending.
• Automating bill payments and savings contributions can help curb unnecessary spending.
What Is Lifestyle Creep?
Lifestyle creep can be a common phenomenon experienced as one progresses through their career. The meaning of lifestyle creep, sometimes known as lifestyle inflation, is the process by which discretionary expenses increase as disposable income increases.
Disposable income is income that isn’t already budgeted for necessities like housing, transportation, and food.
It could include anything from concert tickets to morning lattes to a second home— basically anything that is likely to fall more into a “want” category rather than something strictly “needed.”
Lifestyle creep can put you squarely behind the 8-ball when it comes to getting out of debt, saving for retirement, or meeting other big financial goals. And it’s one reason people can’t escape the vortex of living paycheck-to-paycheck.
Signs of Lifestyle Creep
Here are some specific signals that you may be experiencing lifestyle creep:
• Despite earning more, you are not saving more.
• You have stopped following your budget because you assume you’re earning enough not to have to worry about spending.
• You feel as if you can afford to buy whatever you want and no longer stick to previous limits (such as, say, not spending more than a certain amount on an item of clothing or a piece of furniture).
• While your salary has increased, your credit card debt has risen vs. been paid down.
What Causes Lifestyle Creep?
Graduating from the penny-pinching college life to your first full-time job is only one instance that can trigger lifestyle creep. It also can happen with any type of bump in cash flow that’s not part of your monthly budget, such as a raise, bonus, tax refund, gift, or winning a scratch-off ticket.
There are also psychological factors at play here, including the sometimes compulsive urge to keep up with the Joneses.
And before you blow it off as just envy with a lack of willpower, consider this: One landmark examination of a lottery winner’s effect on the neighborhood found that the larger reward the lucky gambler collected, the more likely their neighbors were to incur more debt and even file for bankruptcy.
The social pressure to keep up with the consumption habits of family and friends, even when it’s conspicuous, can cause real and serious financial stress.
Social media can make matters even worse, with studies showing that post envy could be causing people to live beyond their means just so their feeds can reflect their acquaintances’.
But how do you resist the urge to upgrade your 2015-era sedan when your neighbor rolls up in a shiny new SUV? The answers might be simple on paper, but switching your mindset from “Should I spend this on a shopping spree or a vacation?” to “Should I put this money into savings or invest it?” can be easier said than done.
Discerning Needs Versus Wants
First, a quick refresher on needs vs. wants: A need is something vital to survival, while a want is something that’s nice to have but strictly speaking not critical.
It’s normal to want to celebrate a new raise, but to avoid lifestyle creep, it can be important to make sure not to celebrate with something that will increase costs to the point of making the raise irrelevant.
Examples of Needs vs Wants
Here are a couple of examples of how needs and wants can compare:
• A need is clothing to wear to work, to keep you warm in cold weather, and to enable you to go about your daily life.
• A want would be those two pairs of shoes you bought not because you needed them but because they were cute and on sale.
• A need is groceries to feed your household.
• A want would be buying a pricey salad for lunch every day vs. bringing food from home or going out for a deluxe sushi dinner every Friday night to celebrate the end of the work week.
• A need is basic health care expenses and new running shoes when your old ones wear out.
• A want would be getting massages and hiring a personal trainer.
As you see, lifestyle creep could entice you to spend significant amounts on the “wants” in life because they are fun and you feel you can afford them. But allowing those purchases to increase instead of putting money toward debt reduction and longer-term aspirations can be problematic. After all, part of financial wellness is prioritizing goals such as being able to contribute to your child’s education and having a healthy retirement savings account.
Increase your savings with a limited-time APY boost.*
*Earn up to 4.00% Annual Percentage Yield (APY) on SoFi Savings with a 0.70% APY Boost (added to the 3.30% APY as of 12/23/25) for up to 6 months. Open a new SoFi Checking and Savings account and pay the $10 SoFi Plus subscription every 30 days OR receive eligible direct deposits OR qualifying deposits of $5,000 every 31 days by 3/30/26. Rates variable, subject to change. Terms apply here. SoFi Bank, N.A. Member FDIC.
Tips for Avoiding Lifestyle Creep
Giving every extra penny of a cash windfall to a credit-card company doesn’t sound like much fun. But just knowing that lifestyle creep exists, and recognizing it in your own life, can put you ahead of the game when it comes to making better decisions with your money.
Here are a few possible ways you can avoid lifestyle creep while still enjoying the good things in life.
Celebrating Small
If you earn a raise, you should absolutely celebrate — especially if it’s higher than the average 3.7% forecast for 2025. But to outsmart lifestyle creep, you may want to take a deep breath and resist the urge to run to the store for that expensive thing you’ve had your eye on. Instead, consider a small way to congratulate yourself, like a dinner with friends.
Creating a Budget
One way to avoid lifestyle creep may be to give all income a job to do. That extra $200 a month shouldn’t just be chilling in a checking account with no purpose, like a freeloading cousin camping out on the couch.
Letting that extra money hang out in the checking account too long with nothing to do might lead to unplanned spending. If you see the money sitting idle, you might splurge on a weekend trip or that budget-busting espresso maker. Putting that money to work (earning interest in a high-yield savings account or paying down debt) could be a wise move. And if you have a solid budget in place, using money that way can be effortless.
Building a Budget to Control Lifestyle Inflation
With the advent of online banking, most people are likely equipped with everything needed to make a budget right on your phone or computer. Many financial institutions offer tools that can help with tracking of your money as it flows in and out of your accounts.
Don’t have a basic budget already? Getting a raise can be a great time to crunch the numbers and be financially stable and responsible with that money. There are many different budget techniques you can experiment with, such as the envelope system or the 50/30/20 budget rule. If there’s already a budget in place, a new raise is a great time to reconfigure the budget to make sure it still ticks all the financial boxes.
Avoiding Mindless Spending
Mindless or pointless spending might happen when there is unexpected extra cash sitting in the bank account. Much like the itch to spend that crisp, new $20 bill included in a childhood birthday card, there may be psychological and emotional temptation to spend money in the bank account without considering whether or not a new, say, brand gaming system is really needed.
Casually buying unnecessary items could indicate compulsive or impulsive spending. This in turn could mean missing an opportunity to put money to work for the future, sustainably upgrading a lifestyle by planning ahead for financial growth.
Tracking Your Spending
When it comes to managing money, losing track of expenses could not only lead to a blown budget, but also overdraft fees, returned checks, or other unnecessary fees that could put you even further behind.
Tools to Track Spending
If you really struggle with this one, there’s an app for that. As mentioned above, many financial institutions offer tools for budgeting and tracking exactly where your money is going. Start there, and see if what is available works well for you. If not, there are various third-party apps that you can explore.
Turn on the Auto-Pilot
One of the easiest ways to ensure that you’re only spending what’s in the budget is to automate as many payments and contributions as possible. After all, money you don’t have is a lot easier to not spend.
This strategy can start at work. If you get a raise, you might elect to increase your 401(k) contribution (or start one if you haven’t yet). And while it means that your take-home pay may not change, your money transferred into a retirement account can painlessly grow.
You also can automate online bill payments and savings and investment contributions, all with the intention of getting the money out of your tempted hands ASAP.
Outlining Clear Goals
What’s your endgame? Do you want to retire early with a million dollars or more in the bank? Is owning a home a part of your plan? One key to avoiding lifestyle creep is to set long-term financial goals and keep your eye on the prize.
Two financial goals that can be beneficial to almost everyone include growing a short-term emergency fund and longer-term savings plan. But from there, the sky’s the limit and your goals are entirely up to you.
You can use an online emergency fund calculator to simplify the math while accruing cash. Financial experts suggest having at least three to six months’ worth of living expenses in the account.
Avoiding New Debt
This might seem like a no-brainer, but you aren’t likely to get out of debt if you keep adding new debt to the pile. One key way to avoid debt is to use credit cards responsibly.
Minimizing your debt (and the important credit utilization ratio, which compares what you owe to your credit limit) can be a smart step when avoiding lifestyle creep.
Lifestyle creep likely isn’t impossible to reverse, but one could argue that the further you’ve allowed yourself to fall into the luxury lifestyle, the harder it could be to pull yourself out.
One way to get your head in the game is to make lists, starting with your needs (electricity) vs. wants (electric car.) From there, you could prioritize your “wants” and start to cut from the bottom.
Are there things in your life that just exist because they can? Consider eliminating them completely or finding clever ways to save money, such as shopping consignment vs. retail or eating lunch out one day a week vs. all five.
Choosing Your Friends Wisely
Peer pressure is a powerful motivator, but the perceived wealth of your friends, neighbors, and acquaintances can be a far cry from the actual state of their finances.
If you seem to find yourself in situations where there’s pressure to overspend, including family Disney holidays with all the bells and whistles, nights out on the town, or an invite to a destination wedding, you may want to consider finding a circle of friends who share the same financial goals and lifestyle as you.
After all, it’s a lot easier to say “Let’s just cook at home to save money” to a friend who won’t pressure you to try the trendy new restaurant in town.
Spending a Raise
So what exactly should someone do with extra money after a raise? Paying more into a retirement account, paying off debts, or just putting some extra dollars towards a specific savings goal are some approaches to take. This can allow you to boost your financial wellness and meet your long-term goals vs. getting caught up in impulse buying.
Lifestyle creep is defined as spending more as you progressively earn more. By spending, you miss out on the opportunity to pay down debt and save for future financial goals, such as buying a home or eliminating student loans. By being aware of lifestyle creep and minimizing it, you can stay on budget and manage your money better. Having the right banking partner can also help with that.
Interested in opening an online bank account? When you sign up for a SoFi Checking and Savings account with eligible direct deposit, you’ll get a competitive annual percentage yield (APY), pay zero account fees, and enjoy an array of rewards, such as access to the Allpoint Network of 55,000+ fee-free ATMs globally. Qualifying accounts can even access their paycheck up to two days early.
Better banking is here with SoFi, NerdWallet’s 2024 winner for Best Checking Account Overall.* Enjoy 3.30% APY on SoFi Checking and Savings with eligible direct deposit.
FAQ
How does lifestyle creep impact long-term financial goals?
Lifestyle creep can make it challenging to achieve long-term financial goals. For example, if you get a raise and spend it on fun purchases, you may struggle to accrue enough money to meet long-term goals, such as saving for retirement.
How can I spend mindfully while still enjoying life?
One way to spend mindfully while still enjoying life is to have a budget that includes a small fund for “fun” spending. If you know you have some cash allocated for enjoyable activities or purchases, you may not feel deprived. You might, say, choose not to spend your “fun money” one month and then have twice as much the next month to use.
How do I recover financially after falling victim to lifestyle creep?
A budget can help you stay on track vs. falling victim to lifestyle creep. By carefully tracking your spending, you can avoid overdoing it. Also, you might consider whether social media is triggering you to overspend, or if your current group of friends typically value spending over saving and you therefore follow suit. Minimizing those influences could have a positive effect on your finances.
Can lifestyle creep impact my retirement goals?
Lifestyle creep can impact your retirement goals. If you receive raises but spend the increase in your paycheck on dining out or vacations, you may then be unable to meet your retirement goals and other long-term financial aspirations.
Are there tools to help combat lifestyle creep?
One good tool to help combat lifestyle creep is to have a budget that you can stick with. It can be worthwhile to experiment with different methods to find one that suits you. Also, using tech tools, such as spending trackers, can help you avoid lifestyle creep. They can help you keep tabs on where your money goes. Also, some financial experts advise unsubscribing from marketing emails that advertise sales and can encourage unplanned spending. Similarly, disabling one-click shopping on social media could help combat lifestyle creep.
SoFi Checking and Savings is offered through SoFi Bank, N.A. Member FDIC. The SoFi® Bank Debit Mastercard® is issued by SoFi Bank, N.A., pursuant to license by Mastercard International Incorporated and can be used everywhere Mastercard is accepted. Mastercard is a registered trademark, and the circles design is a trademark of Mastercard International Incorporated.
Annual percentage yield (APY) is variable and subject to change at any time. Rates are current as of 12/23/25. There is no minimum balance requirement. Fees may reduce earnings. Additional rates and information can be found at https://www.sofi.com/legal/banking-rate-sheet
Eligible Direct Deposit means a recurring deposit of regular income to an account holder’s SoFi Checking or Savings account, including payroll, pension, or government benefit payments (e.g., Social Security), made by the account holder’s employer, payroll or benefits provider or government agency (“Eligible Direct Deposit”) via the Automated Clearing House (“ACH”) Network every 31 calendar days.
Although we do our best to recognize all Eligible Direct Deposits, a small number of employers, payroll providers, benefits providers, or government agencies do not designate payments as direct deposit. To ensure you're earning the APY for account holders with Eligible Direct Deposit, we encourage you to check your APY Details page the day after your Eligible Direct Deposit posts to your SoFi account. If your APY is not showing as the APY for account holders with Eligible Direct Deposit, contact us at 855-456-7634 with the details of your Eligible Direct Deposit. As long as SoFi Bank can validate those details, you will start earning the APY for account holders with Eligible Direct Deposit from the date you contact SoFi for the next 31 calendar days. You will also be eligible for the APY for account holders with Eligible Direct Deposit on future Eligible Direct Deposits, as long as SoFi Bank can validate them.
Deposits that are not from an employer, payroll, or benefits provider or government agency, including but not limited to check deposits, peer-to-peer transfers (e.g., transfers from PayPal, Venmo, Wise, etc.), merchant transactions (e.g., transactions from PayPal, Stripe, Square, etc.), and bank ACH funds transfers and wire transfers from external accounts, or are non-recurring in nature (e.g., IRS tax refunds), do not constitute Eligible Direct Deposit activity. There is no minimum Eligible Direct Deposit amount required to qualify for the stated interest rate. SoFi Bank shall, in its sole discretion, assess each account holder's Eligible Direct Deposit activity to determine the applicability of rates and may request additional documentation for verification of eligibility.
See additional details at https://www.sofi.com/legal/banking-rate-sheet.
*Awards or rankings from NerdWallet are not indicative of future success or results. This award and its ratings are independently determined and awarded by their respective publications.
We do not charge any account, service or maintenance fees for SoFi Checking and Savings. We do charge a transaction fee to process each outgoing wire transfer. SoFi does not charge a fee for incoming wire transfers, however the sending bank may charge a fee. Our fee policy is subject to change at any time. See the SoFi Bank Fee Sheet for details at sofi.com/legal/banking-fees/.
Financial Tips & Strategies: The tips provided on this website are of a general nature and do not take into account your specific objectives, financial situation, and needs. You should always consider their appropriateness given your own circumstances.
This content is provided for informational and educational purposes only and should not be construed as financial advice.
Third-Party Brand Mentions: No brands, products, or companies mentioned are affiliated with SoFi, nor do they endorse or sponsor this article. Third-party trademarks referenced herein are property of their respective owners.
Third Party Trademarks: Certified Financial Planner Board of Standards Center for Financial Planning, Inc. owns and licenses the certification marks CFP®, CERTIFIED FINANCIAL PLANNER®
Margin level is a risk-management indicator that helps you understand what influence the currently opened positions have on your account.
The margin level in your options trading account is a formula that tells you how much of your funds are available to open new trades. The higher your margin level percentage, the more funds are available to trade. If the margin level drops too low, you could receive a margin call.
Key Points
• Margin level serves as a risk-management indicator, reflecting the relationship between equity in a trading account and the utilized margin, expressed as a percentage.
• A margin level of 100% indicates that the total equity is equal to the used margin; falling below this threshold may trigger a margin call from brokers.
• Calculating margin level involves dividing equity by used margin and multiplying by 100, with a 0% margin level signifying no open positions.
• Understanding margin level is crucial for traders, as it determines the ability to open new positions and manage potential risks associated with margin trading.
• Trading on margin offers buying power but introduces greater risks; thus, it is essential for traders to manage their positions and leverage carefully.
What Is Margin Level?
Your margin level percentage is a measure of the relationship between the equity in your trading or brokerage account and how much margin is in use. The margin level calculation is expressed as a percentage: (equity / margin) x 100.
It’s helpful to think of margin level as a reading of your trading account’s health. A margin level percentage of 0% means you have no open positions. A margin level of 100% means that the amount of a portfolio’s equity and used margin are equal. Equity is the cash available to trade, plus any unrealized profits and losses on open positions. Many brokers will not allow investors to make new opening trades when the margin level on their options trading account is 100% or less.
When margin level falls below 100%, the broker might issue a margin call. Unless the market moves back in your favor, you must deposit more funds (or assets) into your account when you are hit with a margin call. You can also satisfy a margin call by exiting your current holdings.
The margin level percentage depends on various factors. The volume of your positions and their potential effect on the market can affect your margin level calculation; as can the amount of leverage you use.
Increase your buying power with a margin loan from SoFi.
Borrow against your current investments at just 4.75% to 9.50%* and start margin trading.
💡 Quick Tip: One of the advantages of using a margin account, if you qualify, is that a margin loan gives you the ability to buy more securities. Be sure to understand the terms of the margin account, though, as buying on margin includes the risk of bigger losses.
What Does Margin Level Really Do?
To understand what margin level means, it’s important first to grasp the concept of margin in options trading.
Margin is the amount of cash or securities a trader must deposit in their account before being able to write (or sell) options. You can think of it as a good faith deposit or a form of collateral. The Federal Reserve Board’s Reg T sets margin requirements.
Margin works differently in options and futures accounts than in stock trading
accounts. Margin debt in stock trading refers to the amount of borrowed funds used to buy new shares. This is also referred to as using leverage.
The margin level calculation tells you how much of your funds are available to use for new opening trades. The higher your margin level, the more “free margin” you have. Free margin is the amount of money available to place new trades. Margin is composed of “used” and “free” amounts. Used margin is the aggregate of all the required margin on your existing positions. Free margin, on the other hand, is the difference between equity and used margin.
Margin level also can inform you of how much wiggle room you have in your options trading account, or other types of accounts. A very high margin level percentage means you have a large amount of equity relative to the total amount of required margin. A low margin level calculation tells you that your account might not be far from getting a margin call.
Calculating Margin Level
Calculating margin level is straightforward: Divide the equity by the amount of used margin; then multiple that quotient by 100:
Margin level = (equity / margin) x 100
If you don’t have any open positions, then your margin level calculation will be zero. This can be confusing because usually, a low margin level means your account might be at risk for a margin call. A 0% margin level is the safest and lowest-risk margin level you can have, because in that scenario, you’d have no open positions.
Margin Level Example
Suppose you deposit $10,000 into your account. Before you make any trades, your margin level is 0%, as you don’t have any used margin (the divisor in the earlier-mentioned equation is zero). Your first buy is a call option on shares of XYZ stock, and you pay a $5,000 premium. Your margin level calculation is now 200% ($10,000 / $5,000 = 200%).
Now let’s say you open another $5,000 options position. Your margin level declines to 100% ($10,000 / $10,000 = 100%). We will assume that is the broker’s minimum margin level before a margin call is issued. Later, we’ll detail what happens if your margin level falls below the critical 100% threshold.
💡 Quick Tip: How to manage potential risk factors in a self-directed investment account? Doing your research and employing strategies like dollar-cost averaging and diversification may help mitigate financial risk when trading stocks.
Why Understanding Margin Level Is Important
The margin level percentage is important, as brokers use this figure to determine whether you can open new positions. Many brokerage firms set a minimum margin percentage at 100%. So if your margin percentage drops below that threshold, then you will encounter a margin call — or even a forced liquidation — on one or more of your open trades. If you want to take on new positions, then you’d be forced to sell an existing holding or add more funds to your account.
Margin Level Below 100%
Taking our earlier example a step further, If the market moves against you, and your option values fall to $9,000 on the market, your margin level calculation would decline to below the minimum margin level ($9,000 / $10,000 = 90%). The broker then could issue a margin call.
You have two choices: either sell an existing position or deposit more assets into the account. If you do not act promptly, the broker can sell one of your positions automatically.
Your margin level could fall below 100% based on small moves in the assets you own. Broad market conditions, like volatility, also could affect your account negatively. In an extreme example, Silver Thursday rocked the silver trading market and caused long futures and options positions on silver to suffer severe losses. In turn, this triggered an onslaught of margin calls in the precious metals markets. The moral of the story: It’s important to manage risks carefully when using leverage.
If you’re interested in trading on margin, or just want to know more about it, you’ll need to understand the difference between marginable and non-marginable securities.
Test your understanding of what you just read.
The Takeaway
As discussed, the margin level in your options trading account is a formula that tells you how much of your funds are available to open new trades. Trading on margin is an advanced strategy that comes with greater risk than trading other securities, like stocks or ETFs, for example. But while the risks are greater, so are the potential rewards (and losses).
For experienced traders, using margin can enhance buying power. But using margin and leverage introduces additional risk into the mix, which investors should be aware of.
If you’re an experienced trader and have the risk tolerance to try out trading on margin, consider enabling a SoFi margin account. With a SoFi margin account, experienced investors can take advantage of more investment opportunities, and potentially increase returns. That said, margin trading is a high-risk endeavor, and using margin loans can amplify losses as well as gains.
Opening and funding an Active Invest account gives you the opportunity to get up to $1,000 in the stock of your choice.¹
Photo credit: iStock/fizkes
INVESTMENTS ARE NOT FDIC INSURED • ARE NOT BANK GUARANTEED • MAY LOSE VALUE
SoFi Invest is a trade name used by SoFi Wealth LLC and SoFi Securities LLC offering investment products and services. Robo investing and advisory services are provided by SoFi Wealth LLC, an SEC-registered investment adviser. Brokerage and self-directed investing products offered through SoFi Securities LLC, Member FINRA/SIPC.
For disclosures on SoFi Invest platforms visit SoFi.com/legal. For a full listing of the fees associated with Sofi Invest please view our fee schedule.
Utilizing a margin loan is generally considered more appropriate for experienced investors as there are additional costs and risks associated. It is possible to lose more than your initial investment when using margin. Please see SoFi.com/wealth/assets/documents/brokerage-margin-disclosure-statement.pdf for detailed disclosure information.
Options involve risks, including substantial risk of loss and the possibility an investor may lose the entire amount invested in a short period of time. Before an investor begins trading options they should familiarize themselves with the Characteristics and Risks of Standardized Options . Tax considerations with options transactions are unique, investors should consult with their tax advisor to understand the impact to their taxes.
Financial Tips & Strategies: The tips provided on this website are of a general nature and do not take into account your specific objectives, financial situation, and needs. You should always consider their appropriateness given your own circumstances.
¹Probability of Member receiving $1,000 is a probability of 0.026%; If you don’t make a selection in 45 days, you’ll no longer qualify for the promo. Customer must fund their account with a minimum of $50.00 to qualify. Probability percentage is subject to decrease. See full terms and conditions.
Buying stocks without a broker can be done, typically through the use of a self-administered brokerage service, or one of a couple of different types of investing plans. Buying stocks may help you get started on the path to building wealth. And just like hiring professional movers can help make relocating less stressful, purchasing stocks through a broker can make the process of diversifying your portfolio easier.
That, however, can involve paying commissions and fees to trade stocks and other securities. Potential investors who are trying to curb investment costs might wonder how to buy stocks online without a broker being involved.
Key Points
• Buying stocks without a broker is possible through online brokerage accounts, dividend reinvestment plans, and direct stock purchase plans.
• Full-service brokers may offer additional services like trading advice and personalized investment strategies.
• Direct stock purchase plans allow investors to buy shares directly from the company, while dividend reinvestment plans reinvest dividends to purchase more stock.
• Online brokerage accounts often offer convenience, lower fees, and the ability to customize investment strategies.
• Each option has its pros and cons, and investors should consider their preferences and goals before choosing a method.
How Can I Buy Stocks Without a Broker?
It is possible to buy stocks without a broker. In fact, there are three alternatives to using a full-service broker: opening an online brokerage account, investing in a dividend reinvestment plan, and investing in a direct stock purchase plan. So, the short answer is yes, you can buy stocks without a broker.
But it may be useful to understand why some investors do choose to use a broker when making stock purchases.
Get up to $1,000 in stock when you fund a new Active Invest account.*
Access stock trading, options, alternative investments, IRAs, and more. Get started in just a few minutes.
*Customer must fund their Active Invest account with at least $50 within 45 days of opening the account. Probability of customer receiving $1,000 is 0.026%. See full terms and conditions.
Benefits of Using a Broker to Buy Stocks
As their name implies, stockbrokers can help broker trades of stocks and other securities on behalf of their clients. In return, they may earn commissions for making those trades. But that’s just one thing a full-service broker can do. A stockbroker’s role may also involve:
• Offering trading advice to clients based on their experience with the stock exchange and education.
• Giving their clients additional tips and suggestions, like what investments they should buy and sell or when it makes sense to do so.
• Building relationships with their clients to better understand and inform individual investment strategies.
A stockbroker’s salary is largely dependent on commissions, which means they’ve got to be pretty good at what they do to make a living. Investors can benefit from the education, training, and experience a stockbroker accumulates over the course of their career.
That being said, for most stockbrokers, their payment comes from your trades, which means a client has to pay their stockbroker every time they buy, sell, and trade. For some, the knowledge of a stockbroker is worth the cost of doing business. For others, the idea of DIY investing is more appealing. It all depends on personal preference.
💡 Quick Tip: When you’re actively investing in stocks, it’s important to ask what types of fees you might have to pay. For example, brokers may charge a flat fee for trading stocks, or require some commission for every trade. Taking the time to manage investment costs can be beneficial over the long term.
How to Buy Stocks Online Without a Broker
DIY investors have several options for buying stocks without brokers online. Here’s a closer look at how each one works.
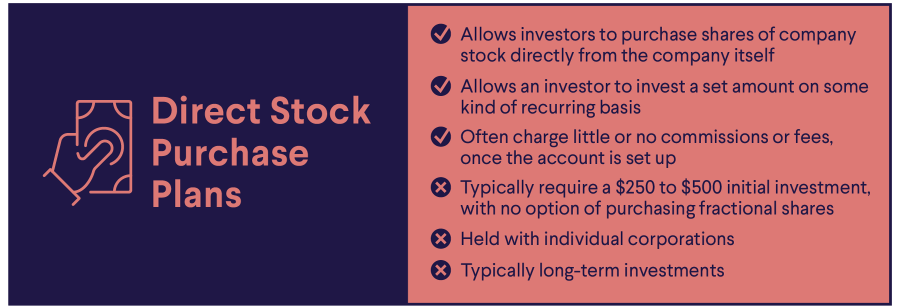
Direct Stock Purchase Plans
Direct Stock Purchase Plans (DSPPs) allow investors to purchase shares of company stock directly from the company itself. Specifically, trades are completed through a transfer agent.That means you could buy stocks without a broker, full-service or online, to complete the transaction.
DSPPs can be offered by companies that are publicly traded on a stock exchange, though not all publicly traded companies offer DSPPs. Each company can determine what minimum investment to require for initial and subsequent stock purchases.
Pros of Buying DSPPs
Buying DSPPs comes with its own unique set of advantages:
• Passive investing: Many DSPPs plans allow an investor to invest a set amount on some kind of recurring basis — sort of a “set it and forget it” strategy.
• Lower fees: DSPPs often charge little or no commissions or fees, once the account is set up.
• An investor might get a discount: Depending on the company a person invests in, they might be offered a slight discount, between 1% and 10%, for investing directly.
Cons of Buying DSPPs
While DSPPs have benefits, there are some drawbacks as well:
• Higher upfront costs: There is typically a cost associated with starting a DSPP account, and DSPPs typically require a $250 to $500 initial investment, with no option of purchasing fractional shares.
• It’s another account: DSPPs are held with individual corporations. So if an investor has DSPP holdings with multiple companies, each will live on the company’s individual platform.
• They’re typically long-term investments: DSPPs don’t offer the same flexibility and speed of an online broker. For that reason, they’re typically considered more appropriate for a long term investment.
Dividend Reinvestment Plans
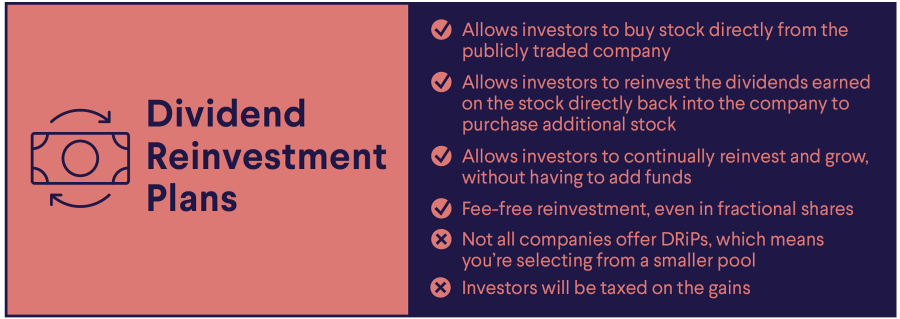
Dividend Reinvestment Plans (DRiPs), share many similarities to DSPPs — in fact, some DSPPs offer DRiP programs. With a DRiP, investors can still buy stock directly from the publicly traded company, but they can also reinvest the dividends earned on the stock directly back into the company to purchase additional stock.
Pros of DRiP Programs
In addition to the benefits of DSPPs, DRiPs have a few to offer on their own if you’d like buy stock without a broker:
• Automated, compounded growth: Reinvesting dividends is not dissimilar to compound interest. DRiPs allow investors to continually reinvest and grow, without having to add funds.
• Fee-free reinvestment, even in fractional shares: Investing the dividends comes fee-free. Investors are also usually offered the opportunity to buy fractions of a share.
Cons of DRiP Programs
DRiPs share many of the same drawbacks as DSPPs, but also have a few specific to them:
• Limited selection: Not all companies that offer DSPPs offer DRiPs, which means you’re selecting from a smaller pool.
• Dividends are still taxable: Although the cash is automatically reinvested in a DRiP, investors will still be taxed on the gains. That means they may want to have liquidity elsewhere to pay the tax.
Online Brokerage Account
Online brokerage accounts offer the convenience of being able to buy stocks online without a traditional full-service broker (and the typical traditional broker fees). Think of it as the difference between dining at a full-service restaurant versus a self-serve buffet.
After opening an account with an online brokerage,an investor can tell their broker what they want to buy, and how much of it. Then the broker completes the order.
Depending on the online broker, there may be low or no fees associated with making a trade.
Pros of Investing with an Online Broker
It might sound pretty easy, but online investing has both pros and cons. Here are a few of the advantages:
• Low fees: When it comes to online investing, people can typically expect to pay lower fees. Many online firms do not charge commissions.
• DIY investing: There’s a lot of freedom that can come with an online brokerage account. An investor gets to choose, creating a customized plan.
• On-demand investing: As long as the markets are open, an investor can ask for trades through their digital brokerage account.
Cons of Investing with an Online Broker
Depending on an investor’s personality and preferences, there may be a few drawbacks to using an online broker:
• It’s all on the investor. Online investing can give investors a lot of choice and freedom, but without the expertise of qualified financial professionals, some investors might be left to research and form a strategy on their own. For some, this might feel stressful.
• It’s for the long term. Since online investing is on-demand, a person can sell whenever they like. That can be a challenge for an investor if patience isn’t their strong suit.
Test your understanding of what you just read.
The Takeaway
It’s possible to buy stocks without a full-time broker. For instance, investors can use an online brokerage account to trade stocks on their own, or invest using different types of investment plans. But there can be pros and cons to each.
While there are some advantages to using a traditional full-service broker to purchase stocks, you don’t necessarily need one in order to invest. However, if you don’t feel comfortable doing it yourself, you can speak with a financial professional for guidance.
Invest in what matters most to you with SoFi Active Invest. In a self-directed account provided by SoFi Securities, you can trade stocks, exchange-traded funds (ETFs), mutual funds, alternative funds, options, and more — all while paying $0 commission on every trade. Other fees may apply. Whether you want to trade after-hours or manage your portfolio using real-time stock insights and analyst ratings, you can invest your way in SoFi's easy-to-use mobile app.
Opening and funding an Active Invest account gives you the opportunity to get up to $1,000 in the stock of your choice.¹
About the author
Rebecca Lake
Rebecca Lake has been a finance writer for nearly a decade, specializing in personal finance, investing, and small business. She is a contributor at Forbes Advisor, SmartAsset, Investopedia, The Balance, MyBankTracker, MoneyRates and CreditCards.com. Read full bio.
INVESTMENTS ARE NOT FDIC INSURED • ARE NOT BANK GUARANTEED • MAY LOSE VALUE
SoFi Invest is a trade name used by SoFi Wealth LLC and SoFi Securities LLC offering investment products and services. Robo investing and advisory services are provided by SoFi Wealth LLC, an SEC-registered investment adviser. Brokerage and self-directed investing products offered through SoFi Securities LLC, Member FINRA/SIPC.
For disclosures on SoFi Invest platforms visit SoFi.com/legal. For a full listing of the fees associated with Sofi Invest please view our fee schedule.
Financial Tips & Strategies: The tips provided on this website are of a general nature and do not take into account your specific objectives, financial situation, and needs. You should always consider their appropriateness given your own circumstances.
¹Probability of Member receiving $1,000 is a probability of 0.026%; If you don’t make a selection in 45 days, you’ll no longer qualify for the promo. Customer must fund their account with a minimum of $50.00 to qualify. Probability percentage is subject to decrease. See full terms and conditions.
When investing, you often want to know how much money an investment is likely to earn you. That’s where the expected rate of return comes in; expected rate of return is calculated using the probabilities of investment returns for various potential outcomes. Investors can utilize the expected return formula to help project future returns.
Though it’s impossible to predict the future, having some idea of what to expect can be critical in setting expectations for a good return on investment.
Key Points
• The expected rate of return is the profit or loss an investor expects from an investment based on historical rates of return and the probability of different outcomes.
• The formula for calculating the expected rate of return involves multiplying the potential returns by their probabilities and summing them.
• Historical data can be used to estimate the probability of different returns, but past performance is not a guarantee of future results.
• The expected rate of return does not consider the risk involved in an investment and should be used in conjunction with other factors when making investment decisions.
What Is the Expected Rate of Return?
The expected rate of return — also known as expected return — is the profit or loss an investor expects from an investment, given historical rates of return and the probability of certain returns under different scenarios. The expected return formula projects potential future returns.
Expected return is a speculative financial metric investors can use to determine where to invest their money. By calculating the expected rate of return on an investment, investors get an idea of how that investment may perform in the future.
This financial concept can be useful when there is a robust pool of historical data on the returns of a particular investment. Investors can use the historical data to determine the probability that an investment will perform similarly in the future.
However, it’s important to remember that past performance is far from a guarantee of future performance. Investors should be careful not to rely on expected returns alone when making investment decisions.
💡 Quick Tip: When you’re actively investing in stocks, it’s important to ask what types of fees you might have to pay. For example, brokers may charge a flat fee for trading stocks, or require some commission for every trade. Taking the time to manage investment costs can be beneficial over the long term.
How To Calculate Expected Return
To calculate the expected rate of return on a stock or other security, you need to think about the different scenarios in which the asset could see a gain or loss. For each scenario, multiply that amount of gain or loss (return) by its probability. Finally, add up the numbers you get from each scenario.
The formula for expected rate of return looks like this:
In this formula, R is the rate of return in a given scenario, P is the probability of that return, and n is the number of scenarios an investor may consider.
For example, say there is a 40% chance an investment will see a 20% return, a 50% chance that the investment will return 10%, and a 10% chance the investment will decline 10%. (Note: all the probabilities must add up to 100%)
The expected return on this investment would be calculated using the formula above:
Expected Return = (40% x 20%) + (50% x 10%) + (10% x -10%)
Expected Return = 8% + 5% – 1%
Expected Return = 12%
What Is Rate of Return?
The expected rate of return mentioned above looks at an investment’s potential profit and loss. In contrast, the rate of return looks at the past performance of an asset.
A rate of return is the percentage change in value of an investment from its initial cost. When calculating the rate of return, you look at the net gain or loss in an investment over a particular time period. The simple rate of return is also known as the return on investment (ROI).
Rate of return = [(Current value − Initial value) ÷ Initial Value ] × 100
Let’s say you own a share that started at $100 in value and rose to $110 in value. Now, you want to find its rate of return.
In our example, the calculation would be [($110 – $100) ÷ $100] x 100 = 10
A rate of return is typically expressed as a percentage of the investment’s initial cost. So, if you were to sell your share, this investment would have a 10% rate of return.
Get up to $1,000 in stock when you fund a new Active Invest account.*
Access stock trading, options, alternative investments, IRAs, and more. Get started in just a few minutes.
*Customer must fund their Active Invest account with at least $50 within 45 days of opening the account. Probability of customer receiving $1,000 is 0.026%. See full terms and conditions.
Different Ways to Calculate Expected Rate of Return
How to Calculate Expected Return Using Historical Data
To calculate the expected return of a single investment using historical data, you’ll want to take an average rate of returns in certain years to determine the probability of those returns. Here’s an example of what that would look like:
Annual Returns of a Share of Company XYZ
Year
Return
2011
16%
2012
22%
2013
1%
2014
-4%
2015
8%
2016
-11%
2017
31%
2018
7%
2019
13%
2020
22%
For Company XYZ, the stock generated a 21% average rate of return in five of the ten years (2011, 2012, 2017, 2019, and 2020), a 5% average return in three of the years (2013, 2015, 2018), and a -8% average return in two of the years (2014 and 2016).
Using this data, you may assume there is a 50% probability that the stock will have a 21% rate of return, a 30% probability of a 5% return, and a 20% probability of a -8% return.
The expected return on a share of Company XYZ would then be calculated as follows:
Expected return = (50% x 21%) + (30% x 5%) + (20% x -8%)
Expected return = 10% + 2% – 2%
Expected return = 10%
Based on the historical data, the expected rate of return for this investment would be 10%.
However, when using historical data to determine expected returns, you may want to consider if you are using all of the data available or only data from a select period. The sample size of the historical data could skew the results of the expected rate of return on the investment.
How to Calculate Expected Return Based on Probable Returns
When using probable rates of return, you’ll need the data point of the expected probability of an outcome in a given scenario. This probability can be calculated, or you can make assumptions for the probability of a return. Remember, the probability column must add up to 100%. Here’s an example of how this would look.
Expected Rate of Return for a Stock of Company ABC
Scenario
Return
Probability
Outcome (Return * Probability)
1
14%
30%
4.2%
2
2%
10%
0.2%
3
22%
30%
6.6%
4
-18%
10%
-1.8%
5
-21%
10%
-2.1%
Total
100%
7.1%
Using the expected return formula above, in this hypothetical example, the expected rate of return is 7.1%.
Calculate Expected Rate of Return on a Stock in Excel
Follow these steps to calculate a stock’s expected rate of return in Excel (or another spreadsheet software):
1. In the first row, enter column labels:
• A1: Investment
• B1: Gain A
• C1: Probability of Gain A
• D1: Gain B
• E1: Probability of Gain B
• F1: Expected Rate of Return
2. In the second row, enter your investment name in B2, followed by its potential gains and the probability of each gain in columns C2 – E2
• Note that the probabilities in C2 and E2 must add up to 100%
3. In F2, enter the formula = (B2*C2)+(D2*E2)
4. Press enter, and your expected rate of return should now be in F2
If you’re working with more than two probabilities, extend your columns to include Gain C, Probability of Gain C, Gain D, Probability of Gain D, etc.
If there’s a possibility for loss, that would be negative gain, represented as a negative number in cells B2 or D2.
Limitations of the Expected Rate of Return Formula
Historical data can be a good place to start in understanding how an investment behaves. That said, investors may want to be leery of extrapolating past returns for the future. Historical data is a guide; it’s not necessarily predictive.
Another limitation to the expected returns formula is that it does not consider the risk involved by investing in a particular stock or other asset class. The risk involved in an investment is not represented by its expected rate of return.
In this historical return example above, 10% is the expected rate of return. What that number doesn’t reveal is the risk taken in order to achieve that rate of return. The investment experienced negative returns in the years 2014 and 2016. The variability of returns is often called volatility.
Standard Deviation
To understand the volatility of an investment, you may consider looking at its standard deviation. Standard deviation measures volatility by calculating a dataset’s dispersion (values’ range) relative to its mean. The larger the standard deviation, the larger the range of returns.
Consider two different investments: Investment A has an average annual return of 10%, and Investment B has an average annual return of 6%. But when you look at the year-by-year performance, you’ll notice that Investment A experienced significantly more volatility. There are years when returns are much higher and lower than with Investment B.
Year
Annual Return of Investment A
Annual Return of Investment B
2011
16%
8%
2012
22%
4%
2013
1%
3%
2014
-6%
0%
2015
8%
6%
2016
-11%
-2%
2017
31%
9%
2018
7%
5%
2019
13%
15%
2020
22%
14%
Average Annual Return
10%
6%
Standard Deviation
13%
5%
Investment A has a standard deviation of 13%, while Investment B has a standard deviation of 5%. Although Investment A has a higher rate of return, there is more risk. Investment B has a lower rate of return, but there is less risk. Investment B is not nearly as volatile as Investment A.
All investments are subject to pressures in the market. These pressures, or sources of risk, can come from systematic and unsystematic risks. Systematic risk affects an entire investment type. Investors may struggle to reduce the risk through diversification within that asset class.
Because of systematic risk, you may consider building an investment strategy that includes different asset types. For example, a sweeping stock market crash could affect all or most stocks and is, therefore, a systematic risk. However, if your portfolio includes different types of bonds, commodities, and real estate, you may limit the impact of the equities crash.
In the stock market, unsystematic risk is specific to one company, country, or industry. For example, technology companies will face different risks than healthcare and energy companies. This type of risk can be mitigated with portfolio diversification, the process of purchasing different types of investments.
Expected Rate of Return vs Required Rate of Return
Expected return is just one financial metric that investors can use to make investment decisions. Similarly, investors may use the required rate of return (RRR) to determine the amount of money an investment needs to generate to be worth it for the investor. The required rate of return incorporates the risk of an investment.
What Is the Dividend Discount Model?
Investors may use the dividend discount model to determine an investment’s required rate of return. The dividend discount model can be used for stocks with high dividends and steady growth. Investors use a stock’s price, dividend payment per share, and projected dividend growth rate to calculate the required rate of return.
The formula for the required rate of return using the dividend discount model is:
So, if you have a stock paying $2 in dividends per year and is worth $20 and the dividends are growing at 5% a year, you have a required rate of return of:
RRR = ($2 / $20) + 0.5
RRR = .10 + .05
RRR = .15, or 15%
What is the Capital Asset Pricing Model?
The other way of calculating the required rate of return is using a more complex model known as the capital asset pricing model.
In this model, the required rate of return is equal to the risk-free rate of return, plus what’s known as beta (the stock’s volatility compared to the market), which is then multiplied by the market rate of return minus the risk-free rate. For the risk-free rate, investors usually use the yield of a short-term U.S. Treasury.
The formula is:
RRR = Risk-free rate of return + Beta x (Market rate of return – Risk-free rate of return)
For example, let’s say an investment has a beta of 1.5, the market rate of return is 5%, and a risk-free rate of 1%. Using the formula, the required rate of return would be:
RRR = .01 + 1.5 x (.05 – .01)
RRR = .01 + 1.5 x (.04)
RRR = .01 + .06
RRR = .07, or 7%
Test your understanding of what you just read.
The Takeaway
There’s no way to predict the future performance of an investment or portfolio. However, by looking at historical data and using the expected rate of return formula, investors can get a better sense of an investment’s potential profit or loss.
There’s no guarantee that the actual performance of a stock, fund, or other assets will match the expected return. Nor does expected return consider the risk and volatility of assets. It’s just one factor an investor should consider when deciding on investments and building a portfolio.
Invest in what matters most to you with SoFi Active Invest. In a self-directed account provided by SoFi Securities, you can trade stocks, exchange-traded funds (ETFs), mutual funds, alternative funds, options, and more — all while paying $0 commission on every trade. Other fees may apply. Whether you want to trade after-hours or manage your portfolio using real-time stock insights and analyst ratings, you can invest your way in SoFi's easy-to-use mobile app.
Opening and funding an Active Invest account gives you the opportunity to get up to $1,000 in the stock of your choice.¹
FAQ
How do you find the expected rate of return?
An investment’s expected rate of return is the average rate of return that an investor can expect to receive over the life of the investment. Investors can calculate the expected return by multiplying the potential return of an investment by the chances of it occurring and then totaling the results.
How do you calculate the expected rate of return on a portfolio?
The expected rate of return on a portfolio is the weighted average of the expected rates of return on the individual assets in the portfolio. You first need to calculate the expected return for each investment in a portfolio, then weigh those returns by how much each investment makes up in the portfolio.
What is a good rate of return?
A good rate of return varies from person to person. Some investors may be satisfied with a lower rate of return if its performance is consistent, while others may be more aggressive and aim for a higher rate of return even if it is more volatile. Ultimately, it is up to the individual to decide what is considered a good rate of return.
INVESTMENTS ARE NOT FDIC INSURED • ARE NOT BANK GUARANTEED • MAY LOSE VALUE
SoFi Invest is a trade name used by SoFi Wealth LLC and SoFi Securities LLC offering investment products and services. Robo investing and advisory services are provided by SoFi Wealth LLC, an SEC-registered investment adviser. Brokerage and self-directed investing products offered through SoFi Securities LLC, Member FINRA/SIPC.
For disclosures on SoFi Invest platforms visit SoFi.com/legal. For a full listing of the fees associated with Sofi Invest please view our fee schedule.
Financial Tips & Strategies: The tips provided on this website are of a general nature and do not take into account your specific objectives, financial situation, and needs. You should always consider their appropriateness given your own circumstances.
¹Probability of Member receiving $1,000 is a probability of 0.026%; If you don’t make a selection in 45 days, you’ll no longer qualify for the promo. Customer must fund their account with a minimum of $50.00 to qualify. Probability percentage is subject to decrease. See full terms and conditions.