Finding Value Is in Season: Even the Rich Are Discount Shopping Now
How America shops is shifting in a fundamental way.
Shoppers are turning to discount stores such as Dollar Tree, ALDI, and Big Lots more often, driven largely by spiking inflation, which peaked at 9.1% in June 2022. These days, shoppers are increasingly asking themselves, Why pay more? as they place a higher premium on value.
According to SoFi’s Discount Shopping Survey of 1,500 consumers fielded in August 2023, 81% of respondents are currently shopping at discount stores at least monthly, regardless of their income level.
Surely, the impetus may vary:
• For many, discount stores are a vital tool when sticking to a tight budget.
• For others, it might be a way to find splurges, both large and small, at the right price.
Still, though circumstances may vary, a whopping 78% of respondents are laser-focused on snagging the lowest possible prices for items on their list.
While shoppers may have been swayed by ambience and amenities at stores in the past, now it’s all about getting top value for every hard-earned dollar. Sticking to — and stretching — one’s budget is the new black. Also worth noting: Among the ranks of discount shoppers are high-earners pulling in six figures.
SoFi’s proprietary research found intriguing and unexpected facts about just who’s hitting the discount stores, what they are hunting for at these retailers, and why the face of shopping may never be the same again.
Where the Buyers Are: 74% of Respondents Dropped Into Dollar Tree

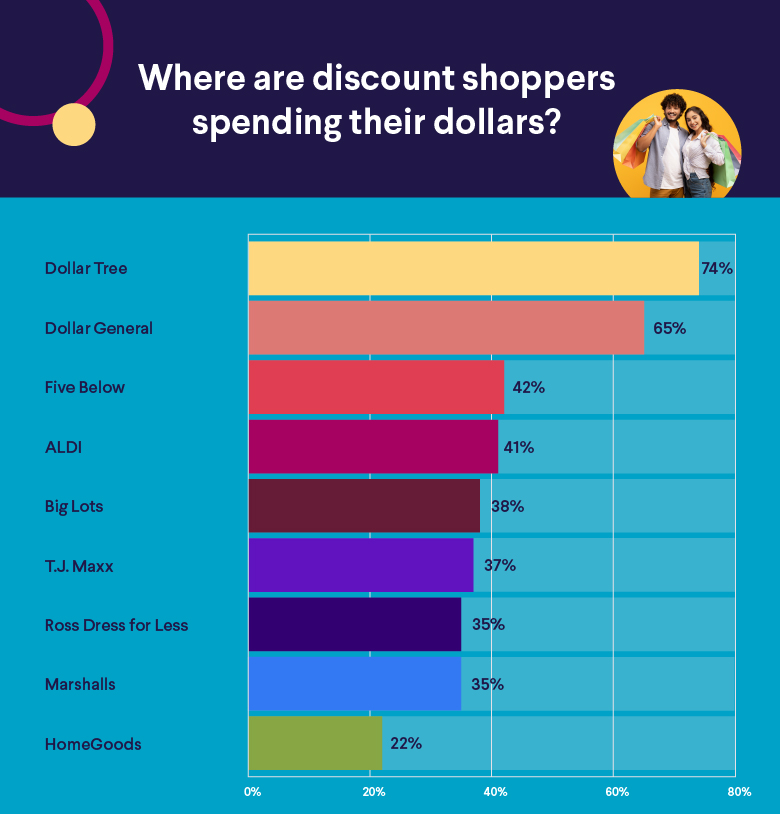
Curious about which discount retailers are topping shoppers’ lists? According to SoFi’s Discount Shopping Survey, almost three-quarters (74%) of discount shoppers have dropped into a Dollar Tree, where the motto is “Extreme Value Every Day,” over the past year.
It isn’t just those living paycheck to paycheck who are shopping at Dollar Tree:
• 64% of the survey’s highest earners (households bringing in $150,000+) say they’ve bought items at Dollar Tree in the last 12 months.
Discount shoppers are also looking elsewhere to find where the best buys are. Over the past year:
• 65% have shopped at Dollar General
• 42% at Five Below
• 41% at ALDI
• 38% at Big Lots
• 37% at T.J. Maxx
• 35% at Ross Dress for Less
• 35% at Marshalls
Where else are moneywise shoppers queuing up? It turns out that 22% have shopped at HomeGoods, while one in five (20%) has rung up items at brand-name outlets (Nordstrom Rack, for instance).
Discount Stores: The New Social Media Darlings
Reflecting their new status as many shoppers’ go-to destination, discount stores are accumulating hefty followings. As of September 2023, the stats are:
• ALDI USA has 955K Instagram followers; 184K on TikTok
• Dollar Tree has 675K Instagram followers; 76.6K on TikTok
• Five Below has 706K Instagram followers; 214.3K on TikTok
💡 Quick Tip: Bank fees eat away at your hard-earned money. To protect your cash, open a checking account with no account fees online — and earn up to 0.50% APY, too.
81% Discount-Shop at Least Once a Month

People aren’t just hitting the discount shops for an occasional find. Rather, SoFi’s discount shopping research uncovered that these retailers are quickly gaining traction as routine destinations for shoppers.
• 81% of respondents shop at discount stores at least once a month.
• 38% — practically four out of ten people — shop at discount stores weekly.
• 14% of respondents say you’ll find them shopping at discount stores several times a week. (These may be people who are saving money daily with their shopping habits.)
Compelling find: Close to half of high-income earners (those making $100,000+ a year) say they shop at discount stores at least weekly.
Inflation Surge Drives Shoppers to Discount Stores

If you’re wondering why discount shopping is surging, consider the economic state of our union. After inflation rates fell month after month for a solid year, July 2023 saw an uptick in prices that surely set some people on edge. (Inflation in July 2023 increased 3.2% from July 2022.)
What’s more, the cost of living is soaring. Social Security recipients enjoyed a cost of living adjustment (COLA) to the tune of 8.7% in 2023, one indicator of how steeply the price of, well, everything has been rising.
Indeed, consider this:
• Nearly two-thirds of discount shoppers (63%) say inflation and rising costs have prompted them to shop at discount stores over the last 12 months.
• In addition, nearly half of discount shoppers have ramped things up, with 49% saying they are hitting discount stores more frequently than they did before the inflation surge.
When it comes to defending one’s paycheck against price hikes, bargain-hunting is a smart maneuver. ”Inflation is real for just about all of us,” says David Bakke, a consumer finance expert and writer at personal finance blog Dollar Sanity. “My discount shopping has definitely increased. I find myself spending a lot more time at ALDI, Dollar General, and the like.”
Indeed, inflation is making over the way Americans shop. SoFi’s discount shopping data shows this significant stat:
• 40% of respondents say they “always” search for ways to save on their purchases when shopping.
• Only 2% said they never search for ways to save.

Here are some of the leading tactics discount shoppers have used to cut costs:
• 41% have used couponing websites.
• 40% have subscribed to company emails.
• 31% have followed a company or brand on social media.
• 21% have joined a Facebook group or other online community.
• 18% have followed an influencer on social media who talks about discount shopping.
More Than Half Discount-Shop to Benefit Their Budget
In these challenging economic times, many consumers are embracing budgeting as a way to manage their finances. Almost six out of 10 discount shoppers (58%) say one of the biggest benefits of shopping at discount stores is the ability to stick to a budget.
This holds true for 62% of those with household incomes under $75K, as well as 46% of those pulling in $100K or more.
Other reasons to love these retailers? SoFi’s discount shopper respondents said:
• Regular availability of discounted products (47%)
• The convenience and accessibility of discount stores (46%)
• The ability to find trendy or seasonal items at lower prices (45%)
Another shopping pattern that SoFi’s discount shopping survey uncovered: A significant number of discount shoppers are making most of their purchases from these lower-priced retailers:
• 36% make more than 50% of their purchases at discount stores.
• Almost one in 10 (9%) of those with household incomes of $150,000 or more do more than 75% of their shopping at discount stores.
First on the Discount Shopping List: Groceries

It’s no secret that food prices can trigger sticker-shock, and that’s not just for luxuries like a pumpkin spice latte. Overall, food prices are ratcheting up 5.9% this year, per the USDA’s numbers, which may explain why consumers are hitting the low-cost stores for items they might otherwise buy at a standard supermarket.
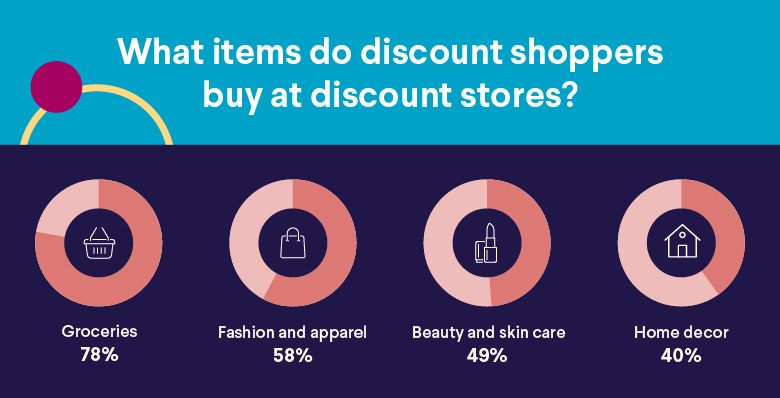
According to the SoFi discount shopping research, groceries are the most common purchase made by discount shoppers: 78% buy groceries at discount stores.
And no wonder: These stores often have an array of staples and snacks, from coffee to cookies, and some are putting a health spin on things, as with Dollar General’s “Better for You” selections. Shopping at discount stores can be a solid way to save money on food.
“I shop at discount grocer ALDI,” says Melissa Cid, consumer savings expert with MySavings.com. “Chips, peanuts, cookies, yogurt, and ice cream are 25% to 50% cheaper than at traditional grocery stores.”
After food, the next most popular items:
• Fashion and apparel: 58%
• Beauty and skin care: 49%
• Home decor: 40%

11% Splash Out When Discount Shopping
Think shoppers are only grabbing cereal, socks, and a bottle of shampoo? Not necessarily.
Yes, many people are hunting for lower-priced essentials at the discount stores, but super-low prices are also leading to big-ticket purchases, for some. According to SoFi’s survey:
• 11% of discount shoppers say the most expensive item they’ve purchased at a discount store in the past 12 months cost $250 or more.
Here is what shoppers say are some of the priciest items they purchased at a discount store:
• 18% say it was a fashion/apparel item.
• 16% say it was an electronic item.
• 13% say it was a home decor item.
“Tech gadgets and home essentials top the list of items that I purchase from discount stores,” explains Thomas Paddock, an Amazon FBA Six-Figure Seller and the founder of Learn Retail Arbitrage, an online selling resource. “These categories often carry substantial markups in conventional retail outlets. Discount stores can offer high-quality items at a more
reasonable cost.”
There is, however, a bit of a gender gap when it comes to shopping for certain items at discount stores:
• 36% of men have purchased electronics vs. 27% of women.
• 67% percent of women have made clothing purchases vs. 44% of men.
• Nearly 3x as many men (22%) have made sports/outdoor purchases vs. women (8%).
Finding Fashion at Discount Shops? Yes, Says Gen Z

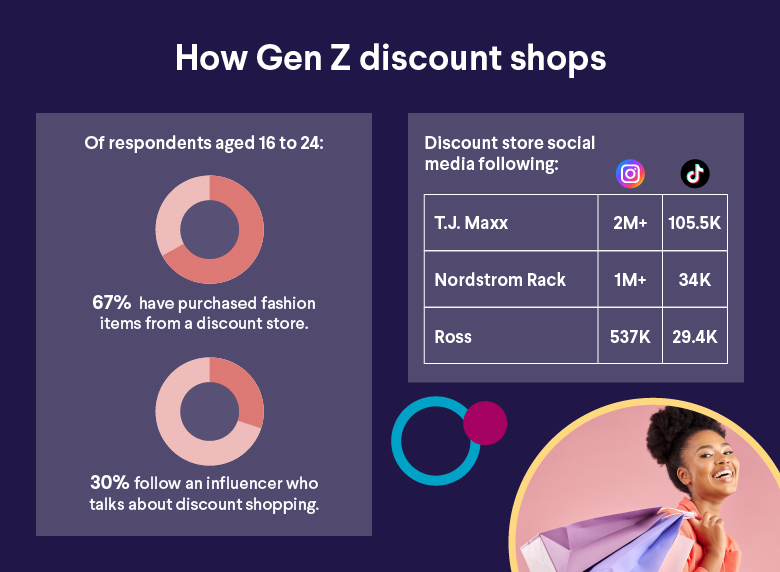
The SoFi discount shopping stats reveal that 67% of young people (aged 16-24) have purchased fashion and apparel items at a discount store within the last year.
Given that Gen Z is broadly recognized as the first digitally native generation, it’s probably no surprise that social media may have led many of them to these style purchases:
• 30% of respondents aged 16-24 have followed an influencer on social media who talks about discount shopping, vs. 18% of total respondents.
And the presence these retailers have on social media channels is significant. On Instagram, as of September 2023, T.J. Maxx has 2+ million followers, Nordstrom Rack has 1+ million followers, and Ross Dress for Less has 537K followers. All three have tens of thousands of followers on TikTok.
Almost 50% of Shoppers Seek Seasonal Wares
Seasonal and holiday shopping is (very) big business in the U.S., with Halloween spending, for instance, totalling $10.6 billion in 2022.
“Here today, gone tomorrow” items are part of the allure of discount stores, where goods can be found at a rock-bottom price. Consider these numbers from the SoFi survey:
• 45% of discount shoppers say one of the biggest benefits of discount stores is the availability of lower-priced trendy or seasonal items.
• 65% of discount shoppers are hunting for clearance or end-of-season items.
• 70% of women look for clearance and end-of-season deals at discount stores vs. 56% of men.
More Than Half of Discount Shoppers Spend Serious Time Bargain-Hunting

The new wave of smart shoppers are dedicated bargain-hunters. They will invest hours to get a great deal. In fact, more than half (51%) will spend between one and three hours extra to find savings or specific items at discount stores. A dedicated 4% are willing to spend five hours or more. (Of these, 63% have a household income of less than $50,000.)
Discount Shoppers Also Prioritize Availability

Low prices are the leading reason for the popularity of discount shopping, but availability of desired products is another big incentive:
• 52% head to these retailers for the specific items they know they can find there.
Whether it’s a favorite energy bar or shower gel, items that are part of a person’s usual shopping list are a big draw for discount shoppers.
This is especially true of the deep-pocketed respondents to the SoFi survey. Why spend top-dollar on your favorite matcha beverages or other small luxuries when you can buy them for much less?
• 60% of the highest earners (household income of $150,000 or more) say one of the reasons they shop at discount stores is for specific items they know they can find there.
There are a good number of impulse buyers among the aisles though:
• Almost one in five (19%) discount shoppers say they don’t go to the stores looking for any particular item. Rather, they “go in without a plan and buy things that speak to them.”
As for the rest of the respondents to SoFi’s survey:
• More than half of discount shoppers (51%) say they know what they need when they go to a discount store, but are open to buying items not on their list.
• More than a quarter (26%) say they buy what they need and exit ASAP.
• Only 3% say they just browse and rarely actually purchase anything.
And the Biggest Frustration With Discount Shopping Is…
Obviously, there is much to love about discount shopping, as detailed above. But, yes, there are a couple of pain points. Here, the two biggest downsides:
• 38% of discount shoppers say the items they want aren’t always available. That suggests that consumers would buy even more at these retailers if they could find everything they are hunting for.
• 22% say that the biggest downside is that the items are of a lower quality.
It seems that getting what you want, when you want it, may matter even more than an item’s quality.
That said, Thomas Paddock of Learn Retail Arbitrage contends that you can find good quality if you shop smart. “Contrary to general assumptions, not every item in a discount store is of inferior quality. Many times, these are overstock products or emerging brands,” he says. “Discount stores can be an avenue to discover value.”
The Takeaway
As inflation increases, shoppers of all income levels are finding that discount stores can serve their needs. Of the 1,500 consumers surveyed for SoFi’s Discount Shopping Survey in August 2023, 81% say they are visiting discount stores (think Dollar Tree, ALDI, and Five Below) at least once a month. Popular purchases are food, fashion, personal care, and home decor items.
What frustrates discount shoppers when seeking their budget buys? Lack of availability first and foremost, followed by lower quality of some goods.
For anyone looking to make the most of their money, finding the right banking partner can also make a big difference. One that charges low or no fees and offers a competitive interest rate can help you make the most of your finances.
Interested in opening an online bank account? When you sign up for a SoFi Checking and Savings account with eligible direct deposit, you’ll get a competitive annual percentage yield (APY), pay zero account fees, and enjoy an array of rewards, such as access to the Allpoint Network of 55,000+ fee-free ATMs globally. Qualifying accounts can even access their paycheck up to two days early.
SoFi Checking and Savings is offered through SoFi Bank, N.A. Member FDIC. The SoFi® Bank Debit Mastercard® is issued by SoFi Bank, N.A., pursuant to license by Mastercard International Incorporated and can be used everywhere Mastercard is accepted. Mastercard is a registered trademark, and the circles design is a trademark of Mastercard International Incorporated.
Annual percentage yield (APY) is variable and subject to change at any time. Rates are current as of 12/23/25. There is no minimum balance requirement. Fees may reduce earnings. Additional rates and information can be found at https://www.sofi.com/legal/banking-rate-sheet
Eligible Direct Deposit means a recurring deposit of regular income to an account holder’s SoFi Checking or Savings account, including payroll, pension, or government benefit payments (e.g., Social Security), made by the account holder’s employer, payroll or benefits provider or government agency (“Eligible Direct Deposit”) via the Automated Clearing House (“ACH”) Network every 31 calendar days.
Although we do our best to recognize all Eligible Direct Deposits, a small number of employers, payroll providers, benefits providers, or government agencies do not designate payments as direct deposit. To ensure you're earning the APY for account holders with Eligible Direct Deposit, we encourage you to check your APY Details page the day after your Eligible Direct Deposit posts to your SoFi account. If your APY is not showing as the APY for account holders with Eligible Direct Deposit, contact us at 855-456-7634 with the details of your Eligible Direct Deposit. As long as SoFi Bank can validate those details, you will start earning the APY for account holders with Eligible Direct Deposit from the date you contact SoFi for the next 31 calendar days. You will also be eligible for the APY for account holders with Eligible Direct Deposit on future Eligible Direct Deposits, as long as SoFi Bank can validate them.
Deposits that are not from an employer, payroll, or benefits provider or government agency, including but not limited to check deposits, peer-to-peer transfers (e.g., transfers from PayPal, Venmo, Wise, etc.), merchant transactions (e.g., transactions from PayPal, Stripe, Square, etc.), and bank ACH funds transfers and wire transfers from external accounts, or are non-recurring in nature (e.g., IRS tax refunds), do not constitute Eligible Direct Deposit activity. There is no minimum Eligible Direct Deposit amount required to qualify for the stated interest rate. SoFi Bank shall, in its sole discretion, assess each account holder's Eligible Direct Deposit activity to determine the applicability of rates and may request additional documentation for verification of eligibility.
See additional details at https://www.sofi.com/legal/banking-rate-sheet.
Financial Tips & Strategies: The tips provided on this website are of a general nature and do not take into account your specific objectives, financial situation, and needs. You should always consider their appropriateness given your own circumstances.
SOBK1023012


