What Are Real Estate Options? Advantages for Buyers

Understanding the Basics of Real Estate Options


Editor's Note: Options are not suitable for all investors. Options involve risks, including substantial risk of loss and the possibility an investor may lose the entire amount invested in a short period of time. Please see the Characteristics and Risks of Standardized Options.

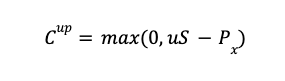
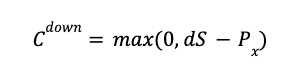
Another way to invest in real estate is through buying or selling real estate options. With an options contract, a buyer is granted the right to purchase a property for a specific price by a specific date, but they are not obligated to buy it.

In order to purchase this option, the buyer of the contract pays the seller a premium.

This is a flexible and typically less expensive way to enter the real estate market that may also help reduce risks involved in single property investment.

What Are Real Estate Options?

Real estate options are contracts between a potential buyer and seller. They grant the buyer the exclusive right to purchase a particular property within terms set in the contract. But the buyer doesn’t have to purchase the property.

However, if the buyer decides to exercise the option and purchase the property, the seller is obligated to sell the property at the agreed-upon price. Once the agreement is entered into, the property owner can’t sell to anyone else within the time period set in the option.

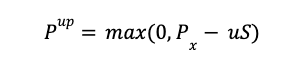
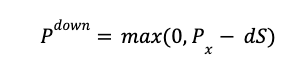
An options contract for a purchase is also known as a call option, whereas an option to sell would be called a put option.

Recommended: Call vs Put Options: Main Differences

How Do Options in Real Estate Work?

Generally, real estate options set a particular purchase price and are valid for anywhere from six months to one year. The buyer doesn’t have to purchase the property, but if they want to, the seller is obligated to sell to them even if the market price has gone up.

The buyer pays what is known as a “premium” in options terminology to enter into the contract. If they decide not to buy the property, the property owner (the seller) keeps that premium.

Real estate options are most often used in commercial real estate, but they can be used by retail investors as well. They aren’t sold on exchanges, and each contract is specific for the property it represents. Usually a contract is only for a single property, not multiple properties.

Real estate options are similar to stock options in that they set a specific price, premium, and period of time for a contract related to an underlying asset. Options can be exercised early or at the expiration date. They can also be sold to another investor.

•   Most of the benefits involved in real estate options tilt in the buyer’s favor.

•   If the property value goes up a few months into the contract, the buyer can exercise the contract and purchase the property, and sell it for a profit.

•   If the property value drops, the buyer can simply let the option expire — thus losing only the premium they paid, which is typically a small percentage of the value of the underlying asset or property in this case.

If the buyer decides not to exercise the contract, they can sell it to another buyer at a potentially higher premium (and pocket the difference).

For a seller, there is the potential for them to make a profit if the buyer exercises their option to purchase the property. They may also profit if the buyer doesn’t exercise the option — at which point they can keep the premium amount, and then sell the contract (or the property) to someone else.


💡 Quick Tip: Options can be a cost-efficient way to place certain trades, because you typically purchase options contracts, not the underlying security. That said, options trading can be risky, and best done by those who are not entirely new to investing.

Lease Options

In addition to real estate options for purchases, there are also lease options. These are rent-to-own agreements between a buyer and seller. They let someone lease a property with the option to buy it after a certain amount of time, but not the obligation.

Generally with a lease option, some or all of the rental payment goes towards the purchase. Some lease options lock in a particular price, but others just give the buyer the exclusive right to buy at whatever the market price is.

Although lease options can be great for buyers, they are also more expensive than simply renting a property since they involve a premium. For this reason, it’s important for a buyer to carefully consider the contract and their future plans before entering into a lease option agreement.

2 Advantages of Real Estate Options for Buyers

Options are a common investing strategy for commercial real estate investors. There are several reasons a buyer might enter into a real estate option contract with a seller.

It Can Allow Time for the Buyer to Amass Funds

One might choose a real estate option if they want to secure a piece of land or property at a certain price but they need some time to get funds in order for the purchase.

A Real Estate Option Locks in a Price

If a buyer thinks the price of a property might go up, they can purchase an option to lock in the current market price. However, some real estate options are not completely set in their sale prices. There may be clauses in the contract to determine what the final sale price will actually be.

2 Advantages of Real Estate Options for Investors

Real estate investors can also use options to their advantage.

It’s a Lower-Risk Way to Develop Property

For example, let’s say an investor finds a property they’re interested in developing into housing. The investor needs to create a plan for the property and get other investors involved before they can buy it, so they purchase a real estate option to give them the exclusive right to buy the land.

The investor can make a profit by bringing in investors at a higher rate than the option. They can then buy the land and sell it to the developers they brought in to make a profit.

If they aren’t able to get developers and investors involved before the contract expires then they simply don’t buy the land.

An Investor Can Buy and Sell Real Estate Options

Investors can also make a profit just on buying and selling real estate options contracts rather than the properties themselves. This is a much less capital-intensive way to get involved in real estate investing.

For instance, an investor might find a property they expect will increase in value in the coming months. They purchase a real estate option to buy the land at the current market rate within the next year, pay a premium, and wait.

At any point during the period of the agreement the investor can either act on the contract and buy the property, or they can sell the contract to someone else. Let’s say the value of the property increases three months into the contract. The investor can find another investor who wants to purchase the contract for them for a higher price than the premium the original investor paid.

Whether any investor buys the property or not, the seller of the property keeps the premium.

The Takeaway

Real estate options are a way for investors to get involved in real estate investing without directly buying properties. As with any other kind of options, the investor buys the right to buy or sell at a certain price, but is not obligated to do so.

SoFi’s options trading platform offers qualified investors the flexibility to pursue income generation, manage risk, and use advanced trading strategies. Investors may buy put and call options or sell covered calls and cash-secured puts to speculate on the price movements of stocks, all through a simple, intuitive interface.

With SoFi Invest® online options trading, there are no contract fees and no commissions. Plus, SoFi offers educational support — including in-app coaching resources, real-time pricing, and other tools to help you make informed decisions, based on your tolerance for risk.

Explore SoFi’s user-friendly options trading platform.

🛈 SoFi does not offer real estate options trading at this time.

Photo credit: iStock/Melpomenem

INVESTMENTS ARE NOT FDIC INSURED • ARE NOT BANK GUARANTEED • MAY LOSE VALUE

SoFi Invest is a trade name used by SoFi Wealth LLC and SoFi Securities LLC offering investment products and services. Robo investing and advisory services are provided by SoFi Wealth LLC, an SEC-registered investment adviser. Brokerage and self-directed investing products offered through SoFi Securities LLC, Member FINRA/SIPC.

For disclosures on SoFi Invest platforms visit SoFi.com/legal. For a full listing of the fees associated with Sofi Invest please view our fee schedule.

Options involve risks, including substantial risk of loss and the possibility an investor may lose the entire amount invested in a short period of time. Before an investor begins trading options they should familiarize themselves with the Characteristics and Risks of Standardized Options . Tax considerations with options transactions are unique, investors should consult with their tax advisor to understand the impact to their taxes.

Financial Tips & Strategies: The tips provided on this website are of a general nature and do not take into account your specific objectives, financial situation, and needs. You should always consider their appropriateness given your own circumstances.

SOIN0723075

Read more

What the Binomial Option Pricing Model Is & How It Works


Editor's Note: Options are not suitable for all investors. Options involve risks, including substantial risk of loss and the possibility an investor may lose the entire amount invested in a short period of time. Please see the Characteristics and Risks of Standardized Options.

The binomial option pricing model is a valuation tool that predicts the price of an asset for selected future points in time then uses an iterative approach to work backwards to determine the present value of options on that underlying asset.

The binomial option pricing model has the benefit of being relatively easy to implement and provides visibility into the linkages between the underlying asset price and the option prices as the expiration date approaches.

What Is the Binomial Option Pricing Model?

The binomial option pricing model is a widely used option pricing formula. There are multiple versions of the model, depending on what assumptions the trader wishes to make and what types of options are to be priced.

Fundamentally, the model involves a three-step process:

1.    Generate the binomial price tree for the underlying asset.

2.    Calculate the options values based on the asset prices for each final node.

3.    Calculate the option value at each preceding node.

Recommended: How to Trade Options

Assumptions of the Binomial Option Pricing Model

The binomial option pricing model assumes two possible outcomes: an up or down change in the stock price. While it’s simple in a one-period approach, the model can quickly turn complex over multiple time frames. However, constructing the pricing tree illustrates how an asset’s price changes from period to period.

Another advantage is that the binomial option pricing model can be used to value American, European, and Bermuda-style options. There are adjustments needed to use the binomial model based on which options are being priced. For this discussion, we will focus on American options only.

Other assumptions in the model discussed herein include that the underlying asset pays no dividends, the interest rate is constant, there are no transaction costs, there are no taxes, and that the risk-free rate is constant.

It also assumes investors are risk-neutral.

💡 Quick Tip: If you’re an experienced investor and bullish about a stock, buying call options (rather than the stock itself) can allow you to take the same position, with less cash outlay. It is possible to lose money trading options, if the price moves against you.

How Does the Binomial Model Work?

The binomial option tree is used for finding the current value of an option. This value is equal to the present value of the probability-weighted future payoffs.

Binomial Option Pricing Model Calculations

Let’s dive into calculations for calls and puts. In order to understand how these calculations are made it helps to know the basics of options trading strategies.

Call Options

A call option gives the holder the right but not the obligation to purchase a security at a specific price at a specific time. A call option is in the money when the stock price is above the strike price. A binomial tree’s nodes will value an option at the maximum of zero or its calculated value.

Recommended: How Options Are Priced

When the underlying asset moves up in price, the call option’s payoff (Cup) is the maximum of zero and the stock price (S) multiplied by the up factor (u) and reduced by the exercise price (Px).

call-options-underlying-asset-moves-up-in-price

When the underlying asset moves down in price, the call option’s payoff (Cdown) is the maximum of zero and the stock price (S) multiplied by the down factor (d) and reduced by the exercise price (Px).

call-options-underlying-asset-moves-down-in-price

The binomial model calculates all possible payoffs, based on these calculations. The final outcomes are then discounted back to calculate the present value.

Put Options

Put options give the holder the right but not the obligation to sell a security at a specific price at a specific time. A put option is in the money when the stock price is below the strike price.

When the underlying asset moves up in price, the put option’s payoff (Pup) is the maximum between zero and the exercise price (Px) minus the stock price (S) multiplied by the up factor (u).

put-options-underlying-asset-moves-up-in-price

When the underlying asset moves down in price, the put option’s payoff (Pdown) is the maximum between zero and the exercise price (Px) minus the stock price (S) multiplied by the down factor (d).

put-options-underlying-asset-moves-down-in-price

Binomial Model Example

Assumptions

XYZ stock is currently trading at $100 and you wish to calculate the value of a call option with a $105 strike price that will expire in two weeks.

You expect that each week the stock may increase by 10% or decrease by 15%. The risk-free rate is currently 5% and you will be looking for cash settlement rather than delivery of shares. Additionally, XYZ is not expected to pay dividends over the two-week holding period.

You want to view how the option price will move weekly up until expiration and calculate the option value today.

Generate the Binomial Tree

We construct the binomial tree for the prices of XYZ stock.

binomial-tree-step-1-price-tree-generation

At the end of one week (1/52 of a year or 0.02 years) the stock will be priced at either $110 or $85.

After two weeks, (0.04 years) the price will increase to $121 if the price moves up twice in a row. The stock price will be $93.50 if the price moves up then down, or down then up. Finally, if the stock moves down twice in a row the stock will drop to $72.25.

Note that we can create a binomial tree for any time period size and include many more steps at the cost of greater complexity in the calculations.

Calculate Final Option Values

Having forecast the stock price two weeks into the future we can calculate the value of the $105 strike price call option at that time.

binomial-tree-step-2-calculate-final-option-values

The call option will only have value if the stock moves up twice in a row. At that time the shares will be worth $121 and the option will be worth $16.

Stock price – Strike price = $121 – $105 = $16

Work Backward to Calculate Present Values

Before we can perform the present value calculations we need to determine the probability that the stock price, and the call option price, will move along the upward path in the binomial tree during each week.

Fortunately we have all the information we need to calculate the probability based on our initial assumptions. The probability for an up move is:

probability-for-an-up-move

Where:

•   t = the time period in years (1 week = 0.02 years)

•   r = the risk-free rate (5%)

•   u = up factor ($110 / $100 = 1.1)

•   D = down factor ($85 / $100 = 0.85)

Substituting into the equation:

probability-for-an-up-move-substituting-into-the-equation

Because there are only two paths at each node the the probability of a down move is:

probability-for-an-down-move

Given the probabilities and the potential option values at the end of week two, we use the present value calculation to determine the option value for the end of week one.

We repeat this process until we arrive at the value of the call option today.

binomial-tree-step-3-work-backward-to-calculate-present-values

At each step we weigh the final values by their respective probabilities and discount by the risk-free rate using the following equation:

discounted-value-equation

discounted-value-with-numbers

Finally, we arrive at the present value of the call option of $5.82.

Finally, user-friendly options trading is here.*

Trade options with SoFi Invest on an easy-to-use, intuitively designed online platform.

Pros and Cons of the Binomial Model

Pros

Cons

Simple to calculate Difficult to predict future prices and probabilities
Can be used on American options Assumes conditions that are not seen in real-world markets
Can be used over multiple periods Complexity grows as more periods are considered

Binomial Option Pricing Model vs Black-Scholes Model

The Black-Scholes model comes to a deterministic result based on the inputs. Its inputs are option variables such as the strike price, the current stock price, the time to expiration, the risk-free rate, and the volatility. While the binomial model is considered path dependent, the Black-Scholes model is path independent.

Widely used in practice and considered accurate, the Black-Scholes model makes assumptions that sometimes arrive at options prices that are different from those seen in the real world.

The Black-Scholes model is considered the standard when valuing European options since the model does not allow for options to be exercised early.

Binomial Option Pricing Model

Black-Scholes Model

Probabilistic approach Deterministic approach
Path dependent with two possible outcomes at each node Usually accurate, but output prices sometimes deviate from those seen in the real world
Helpful for American options Helpful for European options

Binomial Option Pricing Model vs Monte Carlo Model

The Monte Carlo model runs thousands of computer simulations to arrive at a solution. Monte Carlo simulation often includes an array of possible paths — some that show higher ending prices and others that show lower prices.

The computer simulations are only as good as the assumptions used. Analysts can tailor the inputs. Often, historical data is used in Monte Carlo simulations which may lead to results that aren’t applicable.

Binomial Option Pricing Model

Monte Carlo Model

An iterative approach that is path dependent Based on computer simulations
Less computer intensive You can tailor the inputs and scenarios
Uses future assumptions, not historical data Output only as good as the assumptions used

The Takeaway

The binomial option pricing model is a valuation tool that predicts the price of an asset for selected future points in time then uses an iterative approach to work backwards to determine the present value of options on that underlying asset.

Due to its relative simplicity and speed, traders often prefer it to the Black-Scholes and Monte Carlo models.

SoFi’s options trading platform offers qualified investors the flexibility to pursue income generation, manage risk, and use advanced trading strategies. Investors may buy put and call options or sell covered calls and cash-secured puts to speculate on the price movements of stocks, all through a simple, intuitive interface.

With SoFi Invest® online options trading, there are no contract fees and no commissions. Plus, SoFi offers educational support — including in-app coaching resources, real-time pricing, and other tools to help you make informed decisions, based on your tolerance for risk.

Explore SoFi’s user-friendly options trading platform.

FAQ

Who developed the binomial model?

The binomial options pricing model was first suggested by William Sharpe in 1978, but the model’s development is associated with work done by John Cox, Stephen Ross, and Mark Rubinstein in 1979.

Are the Black-Scholes and binomial option pricing models the same?

No, these are two different models. The Black-Scholes model provides a numerical result based on inputs. The binomial options pricing model prices an asset based on a range of possible results. The binomial model is considered an iterative calculation since there is a range of possible outcomes to value options. The Black Scholes model uses fixed inputs to arrive at an option’s value.

How is the binomial option pricing model different from the Monte Carlo model?

The Monte Carlo model runs thousands of computer simulations to eventually arrive at an options price. The model first generates a random number based on a probability distribution. That number then uses additional option inputs like volatility and time to expiration to generate a stock price. The stock price at expiration is then used to calculate the value of the option. The result is only as good as the inputs used.

The model runs that process thousands of times, using different variables from the probability functions. To determine option pricing, the Monte Carlo model uses the average of all the calculated results.


Photo credit: iStock/David Petrus Ibars

INVESTMENTS ARE NOT FDIC INSURED • ARE NOT BANK GUARANTEED • MAY LOSE VALUE

SoFi Invest is a trade name used by SoFi Wealth LLC and SoFi Securities LLC offering investment products and services. Robo investing and advisory services are provided by SoFi Wealth LLC, an SEC-registered investment adviser. Brokerage and self-directed investing products offered through SoFi Securities LLC, Member FINRA/SIPC.

For disclosures on SoFi Invest platforms visit SoFi.com/legal. For a full listing of the fees associated with Sofi Invest please view our fee schedule.

Options involve risks, including substantial risk of loss and the possibility an investor may lose the entire amount invested in a short period of time. Before an investor begins trading options they should familiarize themselves with the Characteristics and Risks of Standardized Options . Tax considerations with options transactions are unique, investors should consult with their tax advisor to understand the impact to their taxes.

Financial Tips & Strategies: The tips provided on this website are of a general nature and do not take into account your specific objectives, financial situation, and needs. You should always consider their appropriateness given your own circumstances.

SOIN1221525

Read more
How Does the Iron Butterfly Spread Work?

What Is an Iron Butterfly Option Strategy?


Editor's Note: Options are not suitable for all investors. Options involve risks, including substantial risk of loss and the possibility an investor may lose the entire amount invested in a short period of time. Please see the Characteristics and Risks of Standardized Options.

An iron butterfly spread is a type of options trade involving four separate options contracts. It’s a complicated and advanced options trade, meaning that many beginner investors will likely never use it — they may not have even heard of it.

Iron butterfly spreads can be used as a part of a larger options trading strategy, however, so long as investors understand the ins and outs of how it works, and most importantly, the risks involved.

What Is an Iron Butterfly?

An iron butterfly spread, sometimes called an “Iron Fly” or a “Butterfly Spread” is a trade involving four separate options contracts.

As a strategy that earns investors money when stocks or futures prices make moves within a defined range, it’s especially popular with traders who expect a decrease in implied volatility. To succeed with an iron butterfly spread, traders will try to forecast when option prices will likely decline, usually when the broader markets are in a holding pattern, or gradually moving upwards.

How Does an Iron Butterfly Trade Work?

An Iron Butterfly is a four-legged options spread, since an investor buys four options contracts, two calls and two puts. The call options allow the investor to buy a stock at a given price, and the put options allow the investor to sell a stock at a given price.

In the trade, the calls and puts have three strike prices, but the same expiration date.

In a put or call option, the strike price is the price an investor can sell the underlying security when it is exercised. With a call option, the strike price is the price at which the investor can buy the security. With a put, the strike price is the value at which they can sell the security.

The three strike prices consist of one in the middle, called the options straddle, and two other strike prices, called the strangle, positioned above and below that price. As a trade, the Iron Butterfly has the propensity to deliver profits when the option’s underlying stock hits its expiration date at the middle strike price.

Recommended: Popular Options Trading Terminology to Know

Example of an Iron Butterfly

For the strategy to work, the call and put options that sit on either side of the target stock price should be far enough apart that they can still make money regardless of the unexpected price movement of the stock between the time when the trade is executed, and the expiration of the options.

As an example, you’re an investor with a sense that a stock would reach $50 in the next month, and that it would be at least within a range of $10 above or below the target price. To make an Iron Butterfly trade, you’d buy a call and a put option with a strike price of $50. Then you’d buy a call option ten dollars higher, followed by a put option ten dollars lower than the target price, or saddle price, of $50.

The theory behind the Iron Butterfly strategy is that there’s a high likelihood that the eventual price of the stock targeted in the strategy will trade within a profitable range by the time the strike price of the options arrives.

Pros and Cons of Iron Butterfly Spreads

There is a limit to the maximum profit that an investor can earn by using the Iron Butterfly. That’s because of the cost of the options they have to buy to make money on their bet, as well as the cost of the options they purchase to protect themselves in the event that their hunch is wrong.

In the strategy, the most money the investor can make becomes possible when the underlying stock reaches the stock price at which they’ve purchased the saddle options. But even in this best-case scenario, at least half of the options expire worthless.

While this limited return may seem like a downside, it also comes with limited risk. As long as the stock rises or falls — at the time of the options’ expiration — between the target price and the strike prices of the outlying call and put options, then the trade will not lose money. But the closer it is to the target price, the more money it will make.

The biggest risk in an Iron Butterfly strategy is that the stock trades outside of the strangle, making all of the options worthless.

Recommended: What Is Your Risk Tolerance?

How to Sell out of an Iron Butterfly Spread

The investor will have at least one option that is in the money, and possibly two options that are in the money, when the options expire. They will exercise those options, and make money on the trade.

Traders realize that it’s unrealistic that any given trade will reach its expiration date exactly at the strike price, or straddle price, that they choose. But with a smart spread on the outer range of the call and put options in the trade, the strategy can deliver returns on the capital put at risk that are consistently in the 15-20% range.

What Is the Difference Between Iron Condor and Iron Butterfly?

An Iron Butterfly is similar to another option strategy known as an Iron Condor. The strategies differ in terms of their strike prices and premiums. In an Iron Condor the strike prices are different and in an Iron Butterfly they’re the same. The premiums are higher in an Iron Butterfly than an Iron Condor.


💡 Quick Tip: In order to profit from purchasing a stock, the price has to rise. But an options account offers more flexibility, and an options trader might gain if the price rises or falls. This is a high-risk strategy, and investors can lose money if the trade moves in the wrong direction.

The Takeaway

The Iron Butterfly is a trading strategy that investors use when they believe that a stock price will trade within a specific range. Rather than buying the stock itself, an Iron Butterfly involves purchasing four options based on the investor’s price prediction for a certain security.

Again, trading options is an advanced investment strategy that requires a good amount of background knowledge and market experience. It may not be a good idea for beginning investors to wade into options, or advanced moves like the Iron Butterfly. However, speaking with a financial professional may help get you prepared for trading options.

SoFi’s options trading platform offers qualified investors the flexibility to pursue income generation, manage risk, and use advanced trading strategies. Investors may buy put and call options or sell covered calls and cash-secured puts to speculate on the price movements of stocks, all through a simple, intuitive interface.

With SoFi Invest® online options trading, there are no contract fees and no commissions. Plus, SoFi offers educational support — including in-app coaching resources, real-time pricing, and other tools to help you make informed decisions, based on your tolerance for risk.

Explore SoFi’s user-friendly options trading platform.


Photo credit: iStock/ponla1975

INVESTMENTS ARE NOT FDIC INSURED • ARE NOT BANK GUARANTEED • MAY LOSE VALUE

SoFi Invest is a trade name used by SoFi Wealth LLC and SoFi Securities LLC offering investment products and services. Robo investing and advisory services are provided by SoFi Wealth LLC, an SEC-registered investment adviser. Brokerage and self-directed investing products offered through SoFi Securities LLC, Member FINRA/SIPC.

For disclosures on SoFi Invest platforms visit SoFi.com/legal. For a full listing of the fees associated with Sofi Invest please view our fee schedule.

Financial Tips & Strategies: The tips provided on this website are of a general nature and do not take into account your specific objectives, financial situation, and needs. You should always consider their appropriateness given your own circumstances.

Options involve risks, including substantial risk of loss and the possibility an investor may lose the entire amount invested in a short period of time. Before an investor begins trading options they should familiarize themselves with the Characteristics and Risks of Standardized Options . Tax considerations with options transactions are unique, investors should consult with their tax advisor to understand the impact to their taxes.


¹Probability of Member receiving $1,000 is a probability of 0.026%; If you don’t make a selection in 45 days, you’ll no longer qualify for the promo. Customer must fund their account with a minimum of $50.00 to qualify. Probability percentage is subject to decrease. See full terms and conditions.

SOIN0723046

Read more
What is a Death Cross Pattern in Stocks? How Do They Form?

What Is a Death Cross Pattern in Stocks? How Do They Form?

A death cross is the X-shape created when a stock’s or index’s short-term moving average descends below the long-term moving average, possibly signaling a sell-off. The death cross typically shows up on a technical chart when the 50-day simple moving average (SMA) of a stock or index peaks, drops, and then crosses below the 200-day moving average.

Because the 50-day SMA is more of a short-term indicator, it’s considered to be a more accurate indicator of potential volatility ahead than the 200-day SMA, which has averaged in 200 days worth of prices. That said, both the 50-day moving average and the 200-day are, by definition, lagging indicators. Meaning: They only capture what has already happened. Still, some death crosses have appeared to forecast major recessions — although they can also send false signals.

What Is a Death Cross, Exactly?

A death cross is based on a technical analysis of a security’s price. The short-term average dropping below the long-term average to create an X-shape is the “cross”; the “death” part of the name refers to the ominous signal that such a crossing may send for individual securities or overall markets.

A death cross tends to form over the course of three separate phases. In the first phase, the rising value of a security reaches its peak as the momentum dies down, and sellers begin to outnumber buyers. That brings on the second phase, in which the price of the security begins to decline to the point where the actual death cross occurs.

That’s typically marked as being when the security’s 50-day moving average dips under the 200-day moving average.
That crossing alerts the broader market to a potential bearish, long-term trend, which brings about the third and final phase of the death cross. In this phase, the stock may continue to lose value over a longer period.

If the dip following the cross is short-lived, and the stock’s short-term moving average moves back up over its long-term moving average, then the death cross is usually considered to be a false signal.


💡 Quick Tip: Are self-directed brokerage accounts cost efficient? They can be, because they offer the convenience of being able to buy stocks online without using a traditional full-service broker (and the typical broker fees).

What Does the Death Cross Tell Investors?

The death cross has helped predict some of some of the worst bear markets of the past 100 years: e.g., in 1929, 1938, 1974, and 2008. Nonetheless, because it’s a lagging indicator, meaning that it only reveals a stock’s past performance, it’s not 100% reliable.

Another criticism of the death cross is that the pattern sometimes won’t show up until a security’s price has fallen well below its peak. In order to alter a death cross calculation to see the downtrend a little sooner, some investors say that a death cross occurs when the security’s trading price (not its short-term moving average), falls under its 200-day moving average.

For experienced traders, investors, and analysts, a death cross pattern for a stock is most meaningful when combined with, and confirmed by, other technical indicators.

When interpreting the seriousness of a death cross, experienced investors will often look at a stock’s trading volume. Higher trading volumes during a death cross tend to reveal that more investors are selling into the death cross, and thus buying into the downward trend of the stock.

Investors will also look to technical momentum indicators to see how seriously to take a death cross. One of the most popular of these is the moving average convergence divergence (MACD), which is based on the moving averages of 15, 20, 30, 50, 100, and 200 days, and is designed to give investors a clearer idea of where a stock is trading than one that’s updated second by second.

Death Cross vs Golden Cross: Main Differences

The opposite of a death cross is known as a golden cross. The golden cross indicator is when the 50-day moving average of a particular security moves higher than its 200-day moving average.

While the golden cross is broadly considered a signal of a bull market, it has some of the same characteristics as the death cross in that it’s essentially a lagging indicator. Experienced investors use the golden cross in conjunction with other technical indicators such as trading volume and MACD.

Is a Death Cross a Reliable Indicator?

Historically, the death cross indicator has an impressive track record as a barometer of the broader stock market, especially when it comes to severe downturns, as noted above.

The Dow Jones Industrial Average (DJIA) went through a death cross shortly before the crash of 1929. More recently, the S&P 500 Index underwent a death cross in May of 2008 – four months before the 2008 crash. In both instances, investors who stayed in the market faced extreme losses. But the Dow also experienced a death cross in March of 2020. And the markets quickly rebounded, and rose to new heights.

The fact is that broad-market death crosses happen frequently. Prior to 2020, the Dow has gone through five death crosses since 2010, and 46 death crosses since 1950. Yet the index has only entered a bear market 11 times since the 1950s. A death cross doesn’t necessarily bring significant losses, either.

Even more noteworthy is that the Dow continued falling after a death cross only 52% of the time since 1950. And when it did keep falling, its median decline after a month was only 0.9%.

For short-term traders, the death cross has less value than it does for investors with longer-term outlooks. As an indicator, the death cross – especially one that’s market-wide – can be especially valuable for long-term investors who hope to lock in their gains before a bear market begins.

How to Trade a Death Cross

The death cross is a significant indicator for some investors. But it’s important to remember that it only shows past trends. As an investor, it’s equally important to use the death cross in conjunction with other indicators such as the MACD and trading volume, as well as other news and information related to the security you’re investing in.


💡 Quick Tip: Look for an online brokerage with low trading commissions as well as no account minimum. Higher fees can cut into investment returns over time.

The Takeaway

Although the ominous-sounding death cross stock pattern is valued by some analysts and investors as a way to foretell a downturn in a certain security or even the broader market, it’s really not that reliable. The main elements of the death cross — a stock’s short-term moving average and long-term moving average — are lagging indicators that may or may not predict a bearish turn of events.

The typical investor may not use or even look for death crosses as a part of their strategy. But knowing, on a basic level, what the term refers to, and why it may be important to the markets, is a good idea.

Invest in what matters most to you with SoFi Active Invest. In a self-directed account provided by SoFi Securities, you can trade stocks, exchange-traded funds (ETFs), mutual funds, alternative funds, options, and more — all while paying $0 commission on every trade. Other fees may apply. Whether you want to trade after-hours or manage your portfolio using real-time stock insights and analyst ratings, you can invest your way in SoFi's easy-to-use mobile app.


Opening and funding an Active Invest account gives you the opportunity to get up to $1,000 in the stock of your choice.¹

Photo credit: iStock/goir


INVESTMENTS ARE NOT FDIC INSURED • ARE NOT BANK GUARANTEED • MAY LOSE VALUE

SoFi Invest is a trade name used by SoFi Wealth LLC and SoFi Securities LLC offering investment products and services. Robo investing and advisory services are provided by SoFi Wealth LLC, an SEC-registered investment adviser. Brokerage and self-directed investing products offered through SoFi Securities LLC, Member FINRA/SIPC.

For disclosures on SoFi Invest platforms visit SoFi.com/legal. For a full listing of the fees associated with Sofi Invest please view our fee schedule.

Financial Tips & Strategies: The tips provided on this website are of a general nature and do not take into account your specific objectives, financial situation, and needs. You should always consider their appropriateness given your own circumstances.


¹Probability of Member receiving $1,000 is a probability of 0.026%; If you don’t make a selection in 45 days, you’ll no longer qualify for the promo. Customer must fund their account with a minimum of $50.00 to qualify. Probability percentage is subject to decrease. See full terms and conditions.

SOIN0723070

Read more
notepad calculator piggy bank layout mobile

What Is Net Worth and Why Should You Know Yours?

A person’s net worth describes their total financial value, and is calculated by subtracting their liabilities from their assets. Though we generally discuss net worth in relation to very wealthy individuals, it can be important for people who aren’t billionaires to know their net worth as well.

A person’s net worth can be an important reference point in understanding one’s financial position. Net worth can be negative, especially early on in one’s careers. But net worth can help an individual figure out how much they need to save, how much spending they need to cut back on, or how much they’ve saved for retirement.

How to Calculate Net Worth

If you’re wondering how to calculate net worth, it’s actually a simple formula:

Assets – Liabilities = Net Worth

The hard part is usually determining a person’s assets and liabilities. And a person’s assets can go beyond what they have in their checking account. In fact, a person’s assets can include a whole host of things.

Assets

Assets basically boil down to how much money you have, as well as the value of things you own. In order to know one’s net worth, estimate the value of each asset below:

•   Money in savings accounts

•   Money in checking accounts

•   Money in investing or retirement accounts. Brokerage accounts or 401(k)s are in this bucket.

•   Physical cash

•   Value from insurance policies

•   Value from business ownership or stakes

•   Value of cars

•   Valuable personal goods, like jewelry or art

•   Value of real estate, including home

Calculating the value of a home can be a task in itself. It’s important to research the value of the homes around you, the size of your home, any deferred maintenance on the home, additional benefits like parking spots, backyard space, room count, etc. There are a number of home value calculators online, too.

Recommended: Understanding Property Valuations

There are other ways to think about assets:

•   Liquid Assets: Items like stocks, bonds, mutual funds, or ETFs that are easy to sell quickly and whose sale will not greatly affect their price.

•   Fixed Assets: These are items that would take a longer time to convert to cash. These assets are often deposited for extended periods of time in exchange for high interest accrual and thus cannot be cashed before their agreed-upon time frame is up.

•   Equity Assets: Equity assets include your shares in a company, either private or public.

Intangible Assets, such as brand recognition for a company or any other intellectual property like patents, trademarks or even goodwill, are trickier to factor into your net worth due to the complexity of measuring their value.

Liabilities

Liabilities are debts. The following categories are what most often make up liabilities:

•   Auto loans

•   Student loans

•   Personal loans

•   Business loans (personally guaranteed)

•   Credit card balances

•   Mortgages

While liabilities are on the negative side of the net worth equation, it doesn’t necessarily have to symbolize something negative about your finances. For example, student loans or mortgage loans are typically seen as necessary loans that individuals take on as they reach milestones in life, like going to college, graduate school or buying a home.

Meanwhile, knowing one’s total liabilities can help with figuring out a plan to start paying off debt that has higher interest rates, like from credit card balances.


💡 Quick Tip: All investments come with some degree of risk — and some are riskier than others. Before investing online, decide on your investment goals and how much risk you want to take.

Median and Average Net Worth in US

An individual or household’s net worth isn’t set in stone, and it ebbs and flows all the time. For that reason, it can be difficult to nail down median or average net worth figures for both individuals and households in the U.S. You can find some numbers if you search for them, but they’re often several years old, and may not be accurate given the time lapse.

For instance, the Federal Reserve tracks median and average net worth data in the U.S., but generally, they do so using survey data that it publishes once every few years. So, while data from a few years ago may be fine, large-scale world events–such as a pandemic, natural disaster, recession, or similar–may have led to large changes in those numbers.

This is all something to keep in mind if you seek out average net worth numbers. It’s not that they’re inaccurate, it’s simply that the data may be hard to capture and synthesize in a reasonable amount of time.

Remember, too, that it’s important to keep abreast of your net worth because this number may fluctuate depending on factors such as stock values, interest rates, real estate trends, and other tides of the financial world. It’s important to have an idea of overall trends so you can generally understand your financial health and have an idea of your true wealth.


💡 Quick Tip: Distributing your money across a range of assets — also known as diversification — can be beneficial for long-term investors. When you put your eggs in many baskets, it may be beneficial if a single asset class goes down.

The Takeaway

True wealth can be an important factor in knowing when you might expect to retire. It’s a good idea to focus on your gains year over year, rather than the number you get at the end of the equation. If you’re concerned about your net worth or are hoping to increase it, especially for future retirement goals, then it might be helpful to consider investing.

There are a multitude of things that can have an effect on your net worth. And focusing strictly on your net worth probably shouldn’t be your focus. If you’re concerned about it, though, it may be worthwhile to talk to a financial professional.

Invest in what matters most to you with SoFi Active Invest. In a self-directed account provided by SoFi Securities, you can trade stocks, exchange-traded funds (ETFs), mutual funds, alternative funds, options, and more — all while paying $0 commission on every trade. Other fees may apply. Whether you want to trade after-hours or manage your portfolio using real-time stock insights and analyst ratings, you can invest your way in SoFi's easy-to-use mobile app.

Opening and funding an Active Invest account gives you the opportunity to get up to $1,000 in the stock of your choice.¹


INVESTMENTS ARE NOT FDIC INSURED • ARE NOT BANK GUARANTEED • MAY LOSE VALUE

SoFi Invest is a trade name used by SoFi Wealth LLC and SoFi Securities LLC offering investment products and services. Robo investing and advisory services are provided by SoFi Wealth LLC, an SEC-registered investment adviser. Brokerage and self-directed investing products offered through SoFi Securities LLC, Member FINRA/SIPC.

For disclosures on SoFi Invest platforms visit SoFi.com/legal. For a full listing of the fees associated with Sofi Invest please view our fee schedule.

Financial Tips & Strategies: The tips provided on this website are of a general nature and do not take into account your specific objectives, financial situation, and needs. You should always consider their appropriateness given your own circumstances.


¹Probability of Member receiving $1,000 is a probability of 0.026%; If you don’t make a selection in 45 days, you’ll no longer qualify for the promo. Customer must fund their account with a minimum of $50.00 to qualify. Probability percentage is subject to decrease. See full terms and conditions.

SOIN0523016U

Read more
TLS 1.2 Encrypted
Equal Housing Lender