The Roth IRA 5-year rule is one of the rules that governs what an investor can and can’t do with funds in a Roth IRA. The Roth IRA 5-year rule comes into play when a person withdraws funds from the account; rolls a traditional IRA account into a Roth; or inherits a Roth IRA account.
Here’s what you need to know.
Key Points
• The Roth IRA 5-year rule requires accounts to be open for five years before earnings can be withdrawn tax-free after age 59 ½.
• Contributions to a Roth IRA can be withdrawn at any time without penalties.
• Exceptions to the 5-year rule include reaching age 59 ½, disability, and using funds for a first home purchase.
• Each conversion from a traditional IRA to a Roth IRA starts a new 5-year period for tax purposes.
• Inherited Roth IRAs also adhere to the 5-year rule, affecting the taxation of earnings withdrawals.
What Is the Roth IRA 5-Year Rule?
The Roth IRA 5-year rule pertains to withdrawals of earnings from a Roth IRA. A quick reminder of how a Roth works: An individual can contribute funds to a Roth IRA, up to annual limits. For 2025, the maximum IRS contrbution limit for Roth IRAs is $7,000, while investors 50 and older can contribute an extra $1,000. For 2026, the maximum contribution limit is $7,500, and investors ages 50 and older can contribute an addiitional $1,100.
Roth IRA contributions can be withdrawn at any time without tax or penalty, for any reason at any age. However, investment earnings on those contributions can only typically be withdrawn tax- and penalty-free once the investor reaches the age of 59 ½ — and as long as the account has been open for at least a five-year period. The five-year period begins on January 1 of the year you made your first contribution to the Roth IRA. Even if you make your contribution at the very end of the year, you can still count that entire year as year one.
Example of the Roth IRA 5-Year Rule
To illustrate how the 5-year rule works, say an investor opened a Roth IRA in 2022 to save for retirement. The individual contributed $5,000 to a Roth IRA and earned $400 in interest and they now want to withdraw a portion of the money. Since this retirement account is less than five years old, only the $5,000 contribution could be withdrawn without tax or penalty. If part or all of the investment earnings is withdrawn sooner than five years after opening the account, this money may be subject to a 10% penalty.
In 2027, the investor can withdraw earnings tax-free from the Roth IRA because the five-year period will have passed.
💡 Quick Tip: How much does it cost to open a new IRA account? Often there are no fees to open an IRA, but you typically pay investment costs for the securities in your portfolio.
Exceptions to the 5-Year Rule
There are some exceptions to the Roth IRA 5-year rule, however. According to the IRS, a Roth IRA account holder who takes a withdrawal before the account is five years old may not have to pay the 10% penalty in the following situations:
• They have reached age 59 ½.
• They are totally and permanently disabled.
• They are the beneficiary of a deceased IRA owner.
• They are using the distribution (up to $10,000) to buy, build, or rebuild a first home.
• The distributions are part of a series of substantially equal payments.
• They have unreimbursed medical expenses that are more than 7.5% of their adjusted gross income for the year.
• They are paying medical insurance premiums during a period of unemployment.
• They are using the distribution for qualified higher education expenses.
• The distribution is due to an IRS levy of the qualified plan.
• They are taking qualified reservist distributions.
5-Year Rule for Roth IRA Conversions
Some investors who have traditional IRAs may consider rolling them over into a Roth IRA. Typically, the money converted from the traditional IRA to a Roth is taxed as income, so it may make sense to talk to a financial or tax professional before making this move.
If this Roth IRA conversion is made, the 5-year rule still applies. The key date is the tax year in which the conversion happened. So, if an investor converted a traditional IRA to a Roth IRA on September 15, 2022, the five-year period would start on January 1, 2022. If the conversion took place on March 10, 2023, the five-year period would start on January 1, 2023. So, unless the conversion took place on January 1 of a certain year, typically, the 5-year rule doesn’t literally equate to five full calendar years.
If an investor makes multiple conversions from a traditional IRA to a Roth IRA, perhaps one in 2023 and one in 2024, then each conversion has its own unique five-year window for the rule.
When the owner of a Roth IRA dies, the balance of the account may be inherited by beneficiaries. These beneficiaries can withdraw money without penalty, whether the money they take is from the principal (contributions made by the original account holder) or from investment earnings, as long as the original account holder had the Roth IRA for at least five years. If the original account holder had the Roth IRA for fewer than five tax years, however, the earnings portion of the beneficiary withdrawals is subject to taxation until the five-year anniversary is reached.
People who inherit Roth IRAs, unlike the original account holders, must take required minimum distributions (RMDs). They can do so by withdrawing funds by December 31 of the 10th year after the original holder died if they died after 2019 (or the fifth year if the original account holder died before 2020), or have the withdrawals taken out based upon their own life expectancy.
💡 Quick Tip: All investments come with some degree of risk — and some are riskier than others. Before investing online, decide on your investment goals and how much risk you want to take.
How to Shorten the 5-Year Waiting Period
To shorten the five-year waiting period, an investor could open a Roth IRA online and make a contribution on the day before income taxes are due and have it applied to the previous year. For example, if one were to make the contribution in April 2023, that contribution could be considered as being made in the 2022 tax year. As long as this doesn’t cause problems with annual contribution caps, the five-year window would effectively expire in 2027 rather than 2028.
If the same investor opens a second Roth IRA — say in 2024 — the five-year window still expires (in this example) in 2027. The initial Roth IRA opened by an investor determines the beginning of the five-year waiting period for all subsequently opened Roth IRAs.
The Takeaway
For Roth IRA account holders, the 5-year rule is key. After the account has been opened for five years, an account holder who is 59 ½ or older can withdraw investment earnings without incurring taxes or penalties. While there are exceptions to this so-called 5-year rule, for anyone who has a Roth IRA account, this is important information to know about.
Prepare for your retirement with an individual retirement account (IRA). It’s easy to get started when you open a traditional or Roth IRA with SoFi. Whether you prefer a hands-on self-directed IRA through SoFi Securities or an automated robo IRA with SoFi Wealth, you can build a portfolio to help support your long-term goals while gaining access to tax-advantaged savings strategies.
Easily manage your retirement savings with a SoFi IRA.
FAQ
Do I have to wait 5 years to withdraw from my Roth IRA?
Because of the Roth IRA 5-year rule, you generally have to wait at least five years before withdrawing earnings tax-free from your Roth IRA. You can, however, withdraw contributions you made to your Roth IRA at any time tax-free.
Does the 5-year rule apply to Roth contributions?
No, the Roth IRA rule does not apply to contributions made to your Roth IRA, only to earnings. You can withdraw contributions you made to your IRA tax-free at any time.
Third-Party Brand Mentions: No brands, products, or companies mentioned are affiliated with SoFi, nor do they endorse or sponsor this article. Third-party trademarks referenced herein are property of their respective owners.
Financial Tips & Strategies: The tips provided on this website are of a general nature and do not take into account your specific objectives, financial situation, and needs. You should always consider their appropriateness given your own circumstances.
Tax Information: This article provides general background information only and is not intended to serve as legal or tax advice or as a substitute for legal counsel. You should consult your own attorney and/or tax advisor if you have a question requiring legal or tax advice.
INVESTMENTS ARE NOT FDIC INSURED • ARE NOT BANK GUARANTEED • MAY LOSE VALUE
SoFi Invest is a trade name used by SoFi Wealth LLC and SoFi Securities LLC offering investment products and services. Robo investing and advisory services are provided by SoFi Wealth LLC, an SEC-registered investment adviser. Brokerage and self-directed investing products offered through SoFi Securities LLC, Member FINRA/SIPC.
For disclosures on SoFi Invest platforms visit SoFi.com/legal. For a full listing of the fees associated with Sofi Invest please view our fee schedule.
Brokerage accounts offer a way into the financial markets: think stocks, bonds, and other securities. Your account enables you to buy, sell, and trade these products. Not all brokerages operate the same way; nor do they all offer the same types of investments. We’ll break down what brokerage accounts are, the different account types available, and how they differ from other financial accounts.
Key Points
Brokerage accounts allow individuals to buy and sell securities.
Cash brokerage accounts allow trading securities using only deposited cash.
Margin accounts offer the ability to borrow for trading, increasing both leverage and risk.
Joint accounts are typically used by partners or family members for shared investments.
Discretionary accounts enable brokers to make investment decisions on behalf of the holder.
What Is a Brokerage Account?
A brokerage account is a type of investing tool offered by investment firms. These accounts allow people to invest their money by buying and selling stocks, bonds, exchange-traded funds (ETFs), and other types of securities.
These accounts are typically flexible and come in various forms, catering to different needs and experience levels. For prospective investors, knowing what a brokerage account is and how they work is important. For seasoned investors, learning even more about them can help deepen their knowledge, too.
What Is a Brokerage Account Used For?
Brokerage accounts open up the world of online investing or investing through a broker in stocks and allows investors to conduct other transactions, such as options trading. They are offered by different types of financial firms as well. Here’s a breakdown of different brokerage accounts, and what each might be used for:
Full-service brokerage firms usually provide a variety of financial services, including allowing you to trade securities. Full-service firms will sometimes provide financial insights and automated investing to customers.
Discount brokerage firms don’t usually provide additional financial consulting or planning services. Thanks to their pared-down services, a discount brokerage firm often offers lower fees than a full-service firm.
Online brokerage firms provide brokerage accounts via the internet, although some also have brick and mortar locations. Online brokers often offer some of the lowest fees and give investors freedom to trade online with ease. They also tend to make information and research available to consumers.
You can start the application either online or in-person. You can then fund your account by transferring money from a checking or savings account.
Some brokerage firms require investors to use cash to open their accounts, and to ensure they have sufficient funding to cover the cost of their investments (as well as any commission fees). Some do not require an initial deposit, however.
Brokerage accounts generally do not have restrictions on deposit or withdrawals. This makes them different from retirement accounts, which typically have more transaction limits or restrictions. Investors do need to claim any profits that they withdraw from their account as taxable income.[1]
Here’s a closer look at how brokerage firm accounts differ from other types of money accounts.
💡 Quick Tip: When you’re actively investing in stocks, it’s important to ask what types of fees you might have to pay. For example, brokers may charge a flat fee for trading stocks, or require some commission for every trade. Taking the time to manage investment costs can be beneficial over the long term.
Get up to $1,000 in stock when you fund a new Active Invest account.*
Access stock trading, options, alternative investments, IRAs, and more. Get started in just a few minutes.
*Customer must fund their Active Invest account with at least $50 within 45 days of opening the account. Probability of customer receiving $1,000 is 0.026%. See full terms and conditions.
How Are Brokerage Accounts Different From Bank Accounts?
Brokerage accounts are different from checking and savings accounts because of how your money is protected. Most checking accounts offered by a bank will come with Federal Deposit Insurance Corporation (FDIC) protection. FDIC insurance protects the first $250,000 per depositor, per bank, per account type.[2]
For example, if you have a checking and a savings account at the same insured bank, the combined balances are covered up to $250,000. If you hold accounts that fall under different ownership categories (e.g., a joint checking account), those accounts may be covered separately, and be insured up to its own $250,000 total.
Brokerage accounts, on the other hand, are often protected by Securities Investors Protection Corporation (SIPC) insurance. The SIPC safeguards customers against losses caused by brokers becoming insolvent. They ensure the return of cash and securities, up to $500,000 (including $250,000 for cash).[3] They do not cover losses due to market fluctuations or investment decisions, however.
Brokerage accounts and checking accounts have one key similarity: both can hold cash. Brokerage accounts will often “sweep” your cash holdings into a money market fund that’s managed by that same brokerage, so that it may potentially earn interest.
Benefits of Having a Brokerage Account
The biggest benefit of a brokerage account is the opportunity to invest. Although a money market account could accrue interest, its funds are designed to be invested rather than held. These accounts come with other advantages as well.
Flexibility and control: Brokerage accounts allow owners to trade financial securities and invest their money as they see fit.
Potential for returns: You may be able to realize gains that are greater than current interest rates. However, they also run the risk of unlimited loss depending on how their investments perform.
No contribution limits: You are only limited by the amount of money you want (or have) to invest. Beginners should seriously consider how much they are willing to lose before funding their account and trading securities.
Liquidity: Brokerage accounts offer full liquidity, enabling you to withdraw and deposit as you please.
Top 3 Types of Brokerage Accounts Explained
There are several types of brokerage accounts: cash brokerage accounts, margin accounts, and discretionary accounts.
1. Cash Brokerage Accounts
Cash brokerage accounts are a straightforward option for investors who want to trade securities without using borrowed funds, or leverage, as you would with a margin account. These accounts only let you invest with the cash you deposit, which can be a simpler approach to investing.
Features:
Simple account structure: Cash brokerage accounts are fairly simple in that investors can trade with whatever they deposit.
Trading ability: Investors have the ability to trade a wide variety of assets, including stocks, bonds, ETFs, and mutual funds.
Pros and Cons:
Brokerage accounts are simple, offer flexibility, and often do not have maintenance fees. They do not offer leverage, which can affect your trading strategies. They may be best for investors seeking simplicity.
2. Margin Brokerage Accounts
Margin brokerage accounts let you use margin when trading. You can effectively borrow money to trade with directly from the brokerage. Thus, you may require approval from a brokerage to open an account. There’s a higher degree of risk with these accounts than cash brokerage accounts, given that you are borrowing money to invest with. There is a significant risk of loss as well as gain.[4]
Features:
Leverage: The ability to borrow funds to increase buying power, allowing you to trade more than your initial balance. Margin comes with interest, however, which can erode potential profits.
Risk management tools: Some margin accounts offer features like stop-loss orders or margin alerts to help manage risks.
Flexibility: Allows for short selling, providing opportunities to profit from declining markets.
Pros and Cons:
Margin accounts increase purchasing power, allowing investors to make larger trades, potentially leading to higher returns and the opportunity to profit from short selling. However, these benefits come with increased risk, as losses can be amplified, interest costs add up, and margin alerts may require investors to deposit additional funds or sell assets, making careful management essential.
3. Prime Brokerage Accounts
Prime brokerage accounts are designed mostly for institutional investors and high-net-worth individuals. These accounts offer advanced services (e.g., margin trading, securities lending) and proprietary research. These are sophisticated tools designed for experienced traders.
Features:
Access to leverage: Prime brokers allow clients to borrow funds for margin trading, enabling higher potential returns (but also increased risk).
Customized services: Tailored to meet the needs of sophisticated clients, including advanced trading strategies and risk management.
Securities lending: Clients can borrow securities to execute short sales, enhancing their trading flexibility.
Clearing and settlement services: Prime brokers handle the logistics of trades, including clearing and settlement, often allowing clients to access a broader range of financial instruments.
Research and reporting: Advanced market research, real-time data feeds, and detailed reporting on positions and trades.
Pros and Cons:
Prime brokers offer access to leverage, allowing clients to borrow funds for margin trading and enhance potential returns, while also providing tailored services for institutional investors or high-net-worth individuals. However, these advantages come with increased risk, as borrowing funds for margin trading amplifies potential losses.
Other Types of Brokerage Accounts
In addition to cash, margin, and joint brokerage accounts, there are other account types that serve specific needs and investment strategies. These accounts cater to different financial goals, investor preferences, and tax implications. Some common alternatives include:
Custodial Accounts: These accounts are set up by an adult for the benefit of a minor, with the custodian managing the assets until the minor reaches the age of majority.
Managed Accounts: In these accounts, a professional portfolio manager makes investment decisions on behalf of the account holder, often for a higher fee.
Each of these account types has unique benefits, tax treatments, and management structures designed to meet specific financial objectives. Depending on your investment goals, it may be advantageous to explore these alternatives to maximize returns and minimize tax liabilities.
How to Choose the Right Brokerage Account for You
Choosing the right brokerage account depends on your investment goals and risk tolerance. For those looking to amplify their investments, a margin account offers leverage, though with added risk. Joint accounts are ideal for shared investments, while more experienced investors may opt for managed or discretionary accounts for professional guidance. Your decision should align with your financial objectives, time horizon, and comfort with risk.
The Takeaway
Brokerage accounts allow owners to buy and sell investments and financial securities. They are offered by a number of financial institutions, and come in a few different types. By and large, though, they’re a very popular choice for investors looking to get their money in the markets.
They do have their pros and cons and associated risks, however. It may be beneficial to speak with a financial professional to learn more about how you can use a brokerage account to your advantage in pursuit of your financial goals.
Invest in what matters most to you with SoFi Active Invest. In a self-directed account provided by SoFi Securities, you can trade stocks, exchange-traded funds (ETFs), mutual funds, alternative funds, options, and more — all while paying $0 commission on every trade. Other fees may apply. Whether you want to trade after-hours or manage your portfolio using real-time stock insights and analyst ratings, you can invest your way in SoFi's easy-to-use mobile app.
Opening and funding an Active Invest account gives you the opportunity to get up to $1,000 in the stock of your choice.¹
FAQ
What is the minimum needed to open a brokerage account?
Different brokerage firms will have different rules regarding minimum deposits, but there are many that don’t require a minimum deposit. Again, it’ll depend on the specific firm.
Can I withdraw money from a brokerage account?
You can withdraw money from a brokerage account by transferring funds to a linked bank account, or by requesting a check or wire transfer. Keep in mind that any profits may be subject to capital gains tax, which may vary depending on how long you’ve held the assets among other factors.
Do you pay taxes on brokerage accounts?
The capital gains, dividends, and interest income earned in the account are all taxable, with long-term capital gains benefiting from lower tax rates compared to short-term gains. The specific tax rate depends on factors, such as how long you hold an asset and your overall income, so it’s best to consult with a tax professional for guidance.
About the author
Samuel Becker
Sam Becker is a freelance writer and journalist based near New York City. He is a native of the Pacific Northwest, and a graduate of Washington State University, and his work has appeared in and on Fortune, CNBC, Time, and more. Read full bio.
INVESTMENTS ARE NOT FDIC INSURED • ARE NOT BANK GUARANTEED • MAY LOSE VALUE
SoFi Invest is a trade name used by SoFi Wealth LLC and SoFi Securities LLC offering investment products and services. Robo investing and advisory services are provided by SoFi Wealth LLC, an SEC-registered investment adviser. Brokerage and self-directed investing products offered through SoFi Securities LLC, Member FINRA/SIPC.
For disclosures on SoFi Invest platforms visit SoFi.com/legal. For a full listing of the fees associated with Sofi Invest please view our fee schedule.
Financial Tips & Strategies: The tips provided on this website are of a general nature and do not take into account your specific objectives, financial situation, and needs. You should always consider their appropriateness given your own circumstances.
¹Probability of Member receiving $1,000 is a probability of 0.026%; If you don’t make a selection in 45 days, you’ll no longer qualify for the promo. Customer must fund their account with a minimum of $50.00 to qualify. Probability percentage is subject to decrease. See full terms and conditions.
When you open a brokerage account with a brokerage firm, you transfer money into the account that you can use to start investing. While some brokerage accounts may set an account minimum, there is typically no limit to how much you can deposit or when you can withdraw your money.
With a brokerage account, investors can invest in a variety of securities, including stocks, bonds, ETFs, and more. There are many brokerages, but the steps to open a brokerage account are similar among most of them.
Key Points
Select a brokerage provider that aligns with your investment goals, considering services and fees.
Complete the online account setup by submitting personal and financial information.
Fund the account by transferring money, similar to a bank deposit.
Start trading stocks, bonds, and ETFs once the account is funded.
SIPC insurance protects up to $500,000 in cash and securities if the brokerage fails.[1] However, if the brokerage firm fails, the account fails, too.
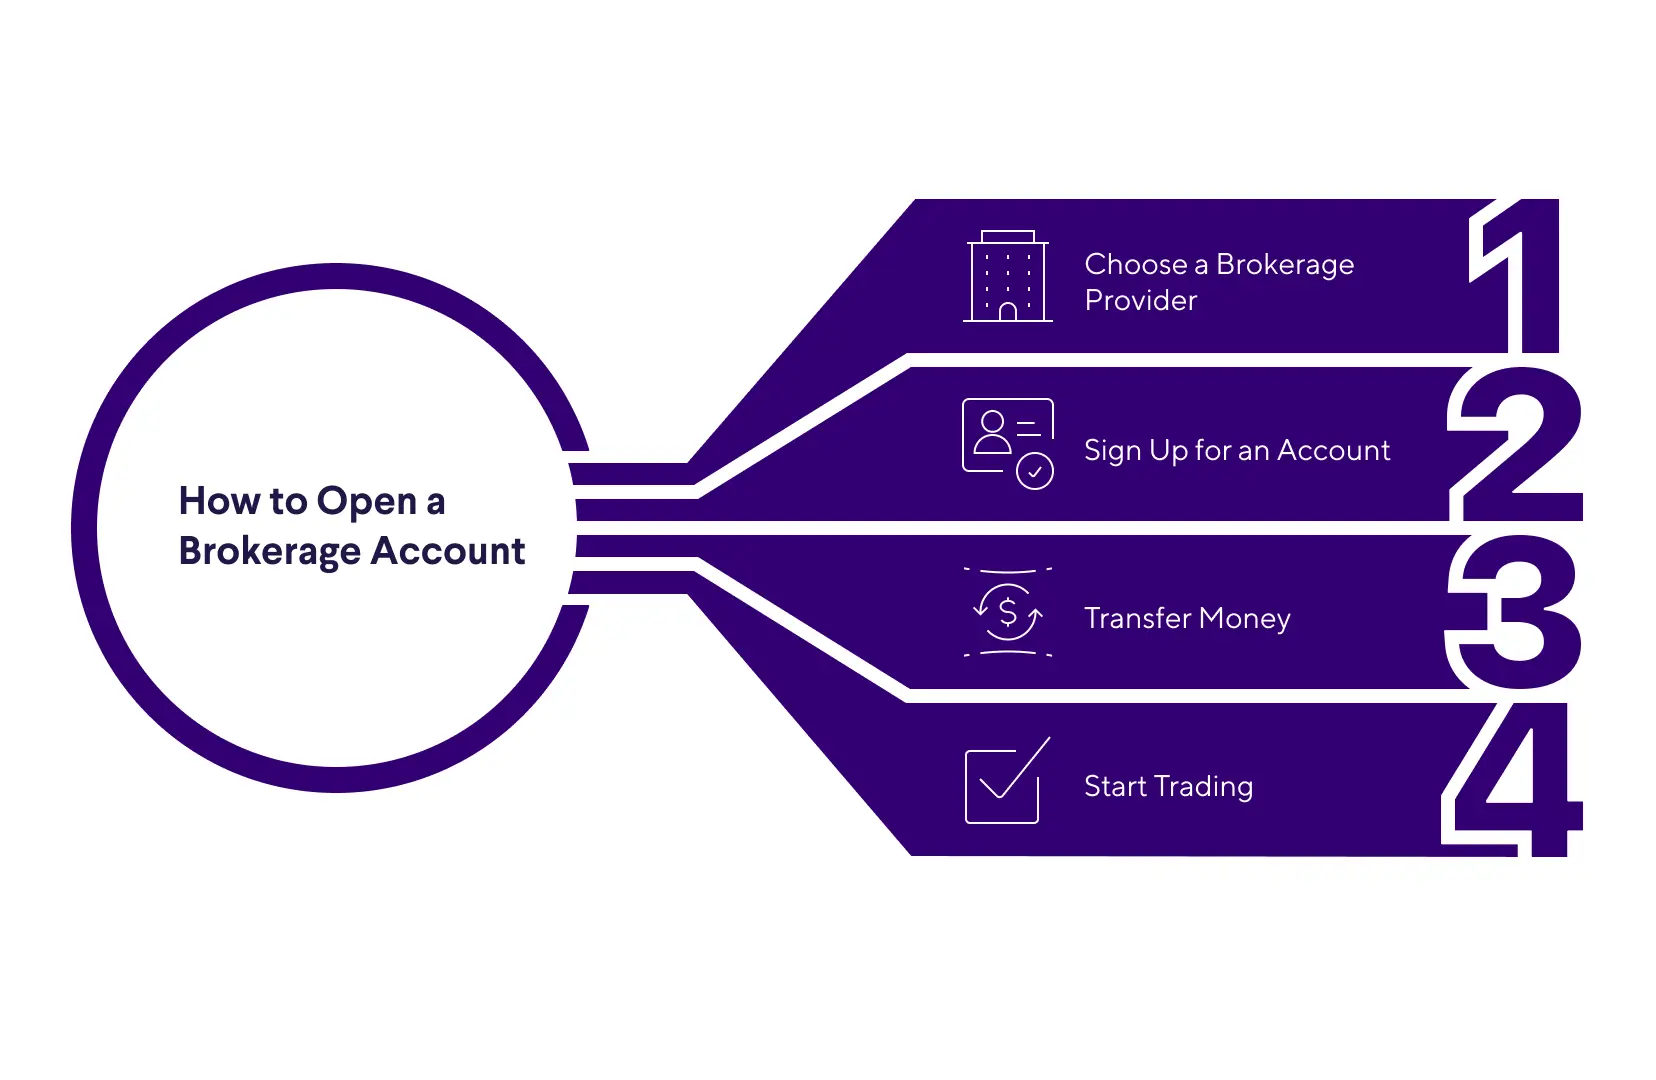
How to Open a Brokerage Account
There are a few simple steps to opening your first brokerage account. We’ll dive deep into each one below.
Choose a brokerage provider.
Sign up for an account.
Transfer money.
Start trading.
Step 1: Choose a Brokerage Provider
There are several types of brokerage accounts[2], and the type you choose will depend on what you’re trying to accomplish.
Full-service brokerage firms not only allow clients to trade securities, they may also offer financial consulting and other services — though the price may be steep, compared to the other options here.
Discount brokerage firms typically charge lower fees than full-service, but as a result clients don’t have access to additional financial consulting or planning services.
Online brokerage firms are typically online-only, allowing clients to sign up, transfer money, and make trades through their website. These firms typically offer the lowest fees.
The accounts above are known as cash accounts: You must buy securities with funds you put in your account ahead of time.
You may also encounter other more complicated types of brokerage accounts known as margin accounts, which allow you to borrow money from your brokerage to make investments, using your case account as collateral. These accounts tend to be for sophisticated investors willing to shoulder the risk that investments bought with borrowed funds will lose value.
Before working with an individual investment advisor or a firm and opening a cash or margin account, it can be a good idea to run a check on their background. The Financial Industry Regulatory Authority (FINRA) offers online broker checks where you can enter a broker’s name, or the name of a firm, to learn whether a broker is registered to sell securities, offer investment advice, or both.[3]
And you can learn about a broker’s employment history, regulatory actions, and whether there are past or current arbitrations and complaints.
Step 2: Sign Up for a Brokerage Account
Most brokers of all kinds allow you to open and access your brokerage account online. When you open the account, you will likely be asked to provide your Social Security number or taxpayer identification number, your address, date of birth, driver’s license or passport information, employment status, annual income and net worth. You may also be asked about your investment goals and risk tolerance.
For the most part, they should not charge you a fee for opening an account. While some may require account minimums, others allow you to open an account with no minimum deposit. There is no limit on the number of brokerage accounts you can open, and you may be able to hold multiple accounts with multiple brokerage firms.
Step 3: Transfer Money
You will need to fund your new brokerage account before you can purchase any types of securities. You can deposit money in a brokerage account like you would in a traditional bank account.
Step 4: Start Trading
Many brokerage firms will offer a way for you to earn interest on uninvested funds so that your money continues to work for you even when not invested in the market.
How Do Brokerage Accounts Work?
The brokerage firm with which you hold your account maintains the account and acts as the custodian for the assets you hold. In other words, the custodian provides a space for investors to use their account in the way that it was intended.
However, you own the investments in the account and can buy and sell them as you wish. The brokerage firm acts as a middleman between you and the markets, matching you with buyers and sellers, and executing trades based on your instructions.
For example, if you place an order with your brokerage to buy a certain number of shares of stock, the brokerage will match you with a seller looking to sell those shares and make the trade for you.
What’s the Difference Between Brokerage Accounts and Retirement Accounts?
Brokerage accounts are also known as taxable accounts, because profits on sales of securities inside the account are potentially subject to capital gains taxes. Generally speaking, these accounts offer no tax advantages for investors.
Retirement accounts, on the other hand, offer a number of tax advantages that may make them preferable to taxable accounts if you’re planning to save for retirement. Retirement accounts place limits on how much money you can contribute and when you can withdraw funds.
If retirement planning is your main concern, you may consider saving as much as you can in both a 401(k) if your employer offers one, and a traditional or Roth IRA. If you have funds left over, you may choose to invest those in your taxable brokerage account.
Is My Money Safe in a Brokerage Account?
The money and securities held in a brokerage account are insured by the Securities Investor Protection Corporation (SIPC). The SIPC protects against the loss of cash and securities held at failing brokerage firms. If your brokerage firm goes bankrupt, the SIPC covers $500,000 worth of losses, including $250,000 in cash losses.
The SIPC only provides protection for the custody function of a brokerage firm. In other words, they work to restore the cash and securities that were in a customer’s account when the brokerage started its liquidation proceedings. The organization does not protect against declines in value of the securities you hold, nor does it protect against receiving and acting upon bad investment advice.
It is important that any investor realizes and accepts that investment comes with a certain amount of risk. While security prices may gain in value, it is also possible that you could lose some or all of your investment.
The Takeaway
Opening a brokerage account is a simple process that allows you to invest in securities. Effectively, you’re depositing money at a brokerage, which will allow you to buy investments such as stocks, bonds, or ETFs. There are numerous brokerages out there, and different types of brokerage accounts.
Invest in what matters most to you with SoFi Active Invest. In a self-directed account provided by SoFi Securities, you can trade stocks, exchange-traded funds (ETFs), mutual funds, alternative funds, options, and more — all while paying $0 commission on every trade. Other fees may apply. Whether you want to trade after-hours or manage your portfolio using real-time stock insights and analyst ratings, you can invest your way in SoFi's easy-to-use mobile app.
Opening and funding an Active Invest account gives you the opportunity to get up to $1,000 in the stock of your choice.¹
FAQ
How do I open a brokerage account?
Broadly speaking, you can open a brokerage account by choosing a broker or brokerage account provider, signing up, transferring money into the account, and then starting to trade or invest.
What are the different types of brokers?
There are several different types of brokerages, and those include full-service brokerage firms, discount brokerage firms, and online brokerage firms. Each type may offer different products and services, or levels of service.
Is money in a brokerage account safe?
While nothing is ever truly safe, money and securities that are held in brokerage accounts are insured by the Securities Investor Protection Corporation, or SIPC, for up to $500,000 in losses.
INVESTMENTS ARE NOT FDIC INSURED • ARE NOT BANK GUARANTEED • MAY LOSE VALUE
SoFi Invest is a trade name used by SoFi Wealth LLC and SoFi Securities LLC offering investment products and services. Robo investing and advisory services are provided by SoFi Wealth LLC, an SEC-registered investment adviser. Brokerage and self-directed investing products offered through SoFi Securities LLC, Member FINRA/SIPC.
For disclosures on SoFi Invest platforms visit SoFi.com/legal. For a full listing of the fees associated with Sofi Invest please view our fee schedule.
Financial Tips & Strategies: The tips provided on this website are of a general nature and do not take into account your specific objectives, financial situation, and needs. You should always consider their appropriateness given your own circumstances.
Disclaimer: The projections or other information regarding the likelihood of various investment outcomes are hypothetical in nature, do not reflect actual investment results, and are not guarantees of future results.
Exchange Traded Funds (ETFs): Investors should carefully consider the information contained in the prospectus, which contains the Fund’s investment objectives, risks, charges, expenses, and other relevant information. You may obtain a prospectus from the Fund company’s website or by emailing customer service at [email protected]. Please read the prospectus carefully prior to investing.
Fund Fees
If you invest in Exchange Traded Funds (ETFs) through SoFi Invest (either by buying them yourself or via investing in SoFi Invest’s automated investments, formerly SoFi Wealth), these funds will have their own management fees. These fees are not paid directly by you, but rather by the fund itself. these fees do reduce the fund’s returns. Check out each fund’s prospectus for details. SoFi Invest does not receive sales commissions, 12b-1 fees, or other fees from ETFs for investing such funds on behalf of advisory clients, though if SoFi Invest creates its own funds, it could earn management fees there.
SoFi Invest may waive all, or part of any of these fees, permanently or for a period of time, at its sole discretion for any reason. Fees are subject to change at any time. The current fee schedule will always be available in your Account Documents section of SoFi Invest.
Utilizing a margin loan is generally considered more appropriate for experienced investors as there are additional costs and risks associated. It is possible to lose more than your initial investment when using margin. Please see SoFi.com/wealth/assets/documents/brokerage-margin-disclosure-statement.pdf for detailed disclosure information.
Tax Information: This article provides general background information only and is not intended to serve as legal or tax advice or as a substitute for legal counsel. You should consult your own attorney and/or tax advisor if you have a question requiring legal or tax advice.
¹Probability of Member receiving $1,000 is a probability of 0.026%; If you don’t make a selection in 45 days, you’ll no longer qualify for the promo. Customer must fund their account with a minimum of $50.00 to qualify. Probability percentage is subject to decrease. See full terms and conditions.
Third Party Trademarks: Certified Financial Planner Board of Standards Center for Financial Planning, Inc. owns and licenses the certification marks CFP®, CERTIFIED FINANCIAL PLANNER®
A company’s financial statements are like a report card that tells investors how much money a company has made, what it spends on, and how much money it currently has.
Knowing how to read a financial statement and understand the key performance indicators it includes is essential for evaluating a company. Any investor conducting fundamental analysis will pull much of the information they need from past and present financial statements when valuing a stock and deciding whether to buy it.
Each publicly traded company in the United States is required to produce a set of financial statements every quarter. These include a balance sheet, income statement, and cash flow statement. In addition, companies produce an annual report. These statements tell a fairly complete story about a company’s financial health.
Key Points
• Financial statements serve as a report card, reflecting a company’s financial health.
• Balance sheets outline assets, liabilities, and shareholder equity.
• Income statements itemize revenue, expenses, and net income.
• Cash flow statements monitor cash inflows and outflows.
• Annual reports and 10-Ks offer extensive insights and management analysis.
Understanding Each Section of a Financial Statement
Along with a company’s earnings call, reading financial statements can give investors clues about whether or not it’s a good idea to invest in a given company.
Here’s what the different sections of a financial statement consist of.
Balance Sheet
A company’s balance sheet is a ledger that shows its assets, liabilities, and shareholder equity at a given point in time. Assets are anything the company owns with quantifiable value. This includes tangible items, such as real estate, equipment, and inventory, as well as intangible items like patents and trademarks. The cash and investments a company holds are also considered assets.
On the other side of the balance sheet are liabilities, or the debts a company owes, including rent, taxes, outstanding payroll expenses and money owed to vendors. When liabilities are subtracted from assets, the result is shareholder value, or owner equity. This figure is also known as book value and represents the amount of money that would be left over if a company shut down, sold all its assets, and paid off its debt. This money belongs to shareholders, whether public or private.
Income Statement
The income statement, also known as the profit and loss (P&L) statement, shows a detailed breakdown of a company’s financial performance over a given period. It’s a summary of how much a company earned, spent, and lost during that time. The top of the statement shows revenue, or how much money a company has made selling goods or providing services.
The income statement subtracts the costs associated with running the business from revenue. These include expenses, costs of goods sold, and asset depreciation. A company’s revenues less its costs are its bottom-line earnings.
The income statement also provides information about net income, earnings per share, and earnings before interest, taxes, depreciation, and amortization (EBITDA).
💡 Quick Tip: The best stock trading app? That’s a personal preference, of course. Generally speaking, though, an effective app is one with an intuitive interface and powerful features to help make trades quickly and easily.
Cash Flow Statement
A cash flow statement is a detailed view of what has happened with regards to a business’ cash over the accounting period. Cash flow refers to the money that’s flowing in and out of a company, and it is not the same as profit. A company’s profit is the money left over after expenses have been subtracted from revenue. The cash flow statement is broken down into three sections:
• Cash flow from operating activities is cash generated by the regular sale of a company’s goods and services.
• Cash flow from investment activity usually comes from buying or selling assets using cash, not debt.
• Cash flow from financing activity details cash flow that comes from debt and equity financing.
At established companies, investors typically look for cash flow from operating activities to be greater than net income. This positive cash flow may indicate that a company is financially stable and has the ability to grow.
Annual Report and 10-K
Public companies must publish an annual report to shareholders detailing their operations and financial conditions. Look for an annual report to include the following:
• A letter from the company’s CEO that gives investors insight into the company’s mission, goals, and achievements. There may be other letters from key company officials, such as the CFO.
• Audited financial statements that describe financial performance. This is where you might find a balance sheet, income statement and cash flow statement. A summary of financial data may provide notes or discussion of financial statements.
• The auditor’s report lets investors know whether the company complied with generally accepted accounting principles as they prepared their financial statements.
• Management’s discussion and analysis (MD&A).
In addition, the Securities and Exchange Commission (SEC) requires companies to produce a 10-K report that offers even greater detail and insight into a company’s current status and where it hopes to go.
The annual report and 10-K are not the same thing. They share similar data, but 10-Ks tend to be longer and denser. The 10-K must include complete descriptions of financial activities. It must outline corporate agreements, an evaluation of risks and opportunities, current operations, executive compensation and market activity. They must be filed with the SEC 60 to 90 days after the company’s fiscal year ends.
Management’s Discussion and Analysis (MD&A)
The management’s discussion and analysis provides context for the financial statements. It’s a chance for company management to provide information they feel investors should have to understand the company’s financial statements, condition, and how that condition has changed or might change in the future. The MD&A also discloses trends, events and risks that might have an impact on the financial information the company reports.
Footnotes
It can be really tempting to skip footnotes as you read financial statements, but they can reveal important clues about a company’s financial health. Footnotes can help explain how a company’s accountants arrived at certain figures and help explain anything that looks irregular or inconsistent with previous statements.
💡 Quick Tip: When you’re actively investing in stocks, it’s important to ask what types of fees you might have to pay. For example, brokers may charge a flat fee for trading stocks, or require some commission for every trade. Taking the time to manage investment costs can be beneficial over the long term.
Financial Statement Ratios and Calculations
Financial statements can be the source of important ratios investors use for fundamental analysis. Here’s a look at some common examples:
Debt-to-equity
To calculate debt-to-equity, divide total liabilities by shareholder equity. It shows investors whether the debt a company uses to fund its operation is tilted toward debt or equity financing. For example, a debt-to-equity ratio of 2:1 suggests that the company takes on twice as much debt as shareholders invest in the company.
Price-to-earnings (P/E)
Calculate price-to-earnings by dividing a company’s stock price by its earnings per share. This ratio gives investors a sense of the value of a company. Higher P/E suggests that investors expect continued growth in earnings, but a P/E that’s too high could indicate that a stock is overvalued compared to its earnings.
Return on equity (ROE)
Calculated by dividing net income by shareholder’s equity, return on equity (ROE) shows investors how efficiently a company uses its equity to turn a profit.
Earnings Per Share
Calculate earnings per share by dividing net earnings by total outstanding shares to understand the amount of income earned for each outstanding share.
Current Ratio
This metric measures a company’s abilities to pay off its short-term liabilities with its current assets. Find it by dividing current assets by current liabilities.
Asset Turnover
Used to measure how well a company is using its assets to generate revenue, you can calculate asset turnover by dividing net sales by average total assets.
The Takeaway
The financial statements that a company provides are all related to one another. For instance, the income statement reflects information from the balance sheet, while cash flow statements can tell you more about the cash on the balance sheet.
Understanding financial statements can give you clues that could help you determine whether a stock is a good value and whether it makes sense to buy or sell.
Invest in what matters most to you with SoFi Active Invest. In a self-directed account provided by SoFi Securities, you can trade stocks, exchange-traded funds (ETFs), mutual funds, alternative funds, options, and more — all while paying $0 commission on every trade. Other fees may apply. Whether you want to trade after-hours or manage your portfolio using real-time stock insights and analyst ratings, you can invest your way in SoFi's easy-to-use mobile app.
Opening and funding an Active Invest account gives you the opportunity to get up to $1,000 in the stock of your choice.¹
FAQ
What does a financial statement tell investors?
There are various types of financial statements, but what they tend to tell investors is how a company is performing in relation to its financial health and key indicators.
What are some examples of financial statements?
Financial statements can include balance sheets, income statements, cash flow statements, and annual reports, among other things.
What does a balance sheet include?
Balance sheet is more or less a ledger that shows a company’s assets, liabilities, and shareholder equity at a given point in time.
Photo credit: iStock/Traimak_Ivan
INVESTMENTS ARE NOT FDIC INSURED • ARE NOT BANK GUARANTEED • MAY LOSE VALUE
SoFi Invest is a trade name used by SoFi Wealth LLC and SoFi Securities LLC offering investment products and services. Robo investing and advisory services are provided by SoFi Wealth LLC, an SEC-registered investment adviser. Brokerage and self-directed investing products offered through SoFi Securities LLC, Member FINRA/SIPC.
For disclosures on SoFi Invest platforms visit SoFi.com/legal. For a full listing of the fees associated with Sofi Invest please view our fee schedule.
Financial Tips & Strategies: The tips provided on this website are of a general nature and do not take into account your specific objectives, financial situation, and needs. You should always consider their appropriateness given your own circumstances.
Tax Information: This article provides general background information only and is not intended to serve as legal or tax advice or as a substitute for legal counsel. You should consult your own attorney and/or tax advisor if you have a question requiring legal or tax advice.
¹Probability of Member receiving $1,000 is a probability of 0.026%; If you don’t make a selection in 45 days, you’ll no longer qualify for the promo. Customer must fund their account with a minimum of $50.00 to qualify. Probability percentage is subject to decrease. See full terms and conditions.
No matter what kind of investments an individual makes, they’ll likely face some kind of investing fee. Investment fees are the charges investors pay to use investment products and services, such as management fees, brokerage fees, and commissions.
Over time, fees can make a profound impact on potential returns. That’s why it’s important to understand those fees, and how they may affect your strategy. Here’s a closer look at the types of investment fees investors may come across.
Key Points
• Investment fees, such as management and trading fees, can vary widely, often around 1% for management.
• Many brokerages and investment platforms have gotten rid of commissions for several types of trades in recent years.
• Over time, fees can significantly reduce investment returns, impacting overall gains.
• Broad-index ETFs and mutual funds generally have lower fees compared to specialized funds.
• Hedge funds traditionally charge “2 and 20,: a fee structure that includes a percentage of assets managed, as well as a performance fee.
What Are Investment Fees?
Investment fees are charges investors pay when using financial products, whether they have short vs. long-term investments. Investing fees can include broker fees, trading fees, management fees, and advisory fees.
Broadly speaking, investing fees are structured in two ways: recurring or one-time transaction charges. Recurring is when the charge is a portion of the assets you’ve invested, usually expressed as an annual percentage rate. One-time transaction charges work more like a flat fee, such as a certain number of dollars per-trade.
💡 Quick Tip: Investment fees are assessed in different ways, including trading costs, account management fees, and possibly broker commissions. When you open an investment account, be sure to get the exact breakdown of your “all-in costs” so you know what you’re paying.
Why Are Investment Fees Charged?
Like any purchase you make, there are fees for investment products and services. For instance, a broker will typically charge a fee for buying and selling stocks or managing your portfolio.
While some investing fees and expenses may seem small, over time they can make an impact on your investment and can affect the value of your portfolio. As an investor, it’s important to be aware of these fees and understand exactly what you’re being charged to help make sure you’re getting a good return on investment.
Who Charges Investment Fees?
Financial professionals such as brokers, financial advisors and financial planners usually charge investing fees and expenses. Brokerage firms typically charge fees and commissions. And there are investment fund fees for various financial products, such as mutual fund management fees and fees for operating and administering a 401(k).
6 Common Types of Investment Fees
Generally, there are a handful of different types of investment fees that investors should know about.
1. Management Fees
When it comes to types of investment costs for mutual funds, every mutual fund charges a management fee. And other investment vehicles, such as hedge funds, do as well. This pays the fund’s manager and support staff to select investments and trade them according to the fund’s mandate. In addition to the manager, it also covers the administrative expenses of managing the fund.
This fee is typically assessed as a portion of an investor’s assets, whether the investments do well or not. Some investments, such as hedge funds, charge a performance fee based on the success of the fund, but these are not widely used in most mutual funds.
Management fees vary widely. Some index funds charge as little as 0.10%, while other highly specialized mutual funds may charge more than 2%.
Management fees are expressed as an annual percentage. If you invest $100 in a fund with a 1% management fee, and the fund neither goes up or down, then you will pay $1 per year in management fees.
2. Hedge-fund Fees: Two and Twenty
The classic hedge-fund fee structure is known as “two and twenty” or “2 and 20.” This means that there’s a 2% management fee, so the hedge fund takes 2% of the investor’s assets that are invested. And then there’s a 20% performance fee, so with any profits that are made, the hedge fund takes an additional 20% of those returns.
So let’s say an investor puts $1 million into a hedge fund, and the firm makes a profit of $500,000 in a year. That means the hedge fund would take a management fee of $20,000 plus a performance fee of $100,000 for a total compensation of $120,000.
Bear in mind, investors who are clients at hedge funds are typically institutional investors or accredited investors, those typically with a net worth of at least $1 million, excluding their primary residence. Hedge funds also tend to have higher minimum initial investment amounts, ranging from $100,000 to $2 million, although it varies from firm to firm.
Due to lackluster performance and competition however in recent years, the classic “two and twenty” hedge-fund fee model has become challenged in many years. Many hedge funds now offer rates like “1 and 10” or “1.5 and 15”–a trend dubbed as “fee compression” in the industry.”
3. Expense Ratio
The expense ratio is the percentage of assets subtracted for costs associated with managing the investment. So if the expense ratio is 0.035%, that means investors will pay $3.50 for every $10,000 invested.
The expense ratio includes the management fee, and tells the whole story as to how much of the fund’s assets go toward the people running and selling the fund.
In addition to management fees, a mutual fund may charge other annualized fees. Those can include the fund’s advertising and promotion expense, known as the 12b-1 fee. Those 12b-1 fees are legally capped at 1% annually. But when added to the management fee, it can make a fund more costly than at first glance. That’s one reason to double check the expense ratio.
Another reason is that the expense ratio may actually be lower than the management fee. That’s because some mutual funds will waive a portion of their fees. They may implement a fee waiver to compete for the dollars of fee-wary investors. Or they may do so as a way to hold onto investors after the fund has underperformed.
In the 2010s, some money market funds waived or reimbursed some of their fees after historically low bond yields wiped out any return they offered to investors. While mutual fund companies can reimburse part or all of a fund’s 12b-1 fee, it happens very rarely.
4. Sales Charges
In addition to the annual management and possibly also 12b-1 fees, mutual fund investors may pay sales charges.
Typically, these charges only apply to mutual fund purchases that an investor makes through a financial planner, or an investment advisor. This fee, also called a sales load, is how the advisor gets paid for their service. It isn’t a transaction fee however. Rather it’s a percentage of the assets being invested.
While the maximum legal sales charge for a mutual fund is 8.5%, the common range is between 3% and 6%.
These sales charges can come in different forms. Front-end sales charges come out of an investor’s assets at the time of the sale. Back-end sales charges, on the other hand, are deducted from the investment when the investor chooses to sell. Lastly, contingent deferred sales charges may not come out at all, if the investor stays in the fund for a specified period of time.
5. Advisory Fees
When an investing professional–a financial planner, advisor, or broker–offers advice, this is how they’re paid. Some advisors have a business model where they charge a percentage of invested assets per year. Other advisors, though, charge a transaction fee, in the form of a brokerage commission. Lastly, some simply charge an hourly fee.
Asset-based money management fees are usually expressed as a percentage of the assets invested through them. Typically, a hands-on professional will charge 1% or more per year for their services. That fee is most often deducted from an account on a quarterly basis. And it comes on top of the fees charged by any professionally managed vehicles, such as mutual funds.
But that fee can be much lower for automated investing platforms, also known as “robo-advisors.” Some of these robo-advisors charge annual advisory fees as low as 0.25%. But it’s worth noting that these platforms often rely heavily on mutual funds, which charge their own fees in addition to the platform fees.
Robo-advisors are famous for having rock-bottom fees. However, when investors are comparing robo-advisor fees, they’ll see that there’s a wide range. The minimum balances can also determine what sort of fees investors pay, and there may be additional fees like a potential set-up payment.
When an investor wants to buy or sell a stock, bond or an exchange traded fund (ETF), they typically use a brokerage firm. Fees and commissions vary widely depending on the type of transaction and the type of broker. Those fees can be based on a percentage of the transaction’s value, or it can be a flat fee, or a combination of the two.
And when investing, that fee depends on whether an investor uses a full-service broker or a discount broker. While a full-service broker can offer a wide range of advice and services, their commissions per trade are far higher than a discount or online brokerage might charge.
Because discount brokers offer less in the way of advice and services, they can charge a lower flat fee per trade. In recent years, the biggest online brokerage firms have offered free trading, partly due to competition and partly because they instead get paid through a practice known as payment for order flow.
Payment for order flow, or PFOF, is the practice of retail brokerage firms sending customer orders to firms known as market makers. In exchange, the brokerage firms receive fees for that order flow.
While widespread and legal, payment for order flow has been controversial because critics say it misaligns the incentives of brokerage firms and their customers. They argue that customers may actually be “paying” for their trades by getting worse prices on their orders. Defenders argue customers get better prices than they would on public exchanges and benefit from zero commissions.
💡 Quick Tip: Are self-directed brokerage accounts cost efficient? They can be, because they offer the convenience of being able to buy stocks online without using a traditional full-service broker (and the typical broker fees).
Cost of Investment Fees
The cost of investment fees can vary depending on the type of fee, who is charging it, and the type of account an investor has. For instance, a standard management fee is about 1%.
A broker or brokerage might charge an annual fee of $50 to $75 a year. Not all brokers have an annual fee, so try to find one that doesn’t.
A broker might also charge anywhere from a few dollars to $30 for research. Again, not all brokers levy this charge, so choose a broker that doesn’t charge for research.
In addition, trading platform fees may range from $50 to $200 or more a month. You might also have to pay transfer or closing fees of $50 to $75 to have the brokerage transfer your account elsewhere or close it out.
Pros and Cons of Investment Fees
There are obvious drawbacks of investment fees. The biggest: Investment fees can diminish the returns on your investments. For instance, if your return was 8%, but you paid 1% in fees, your return is actually 7%. Over the years, that difference can be significant.
When it comes to benefits, there may be some advantages to using a fee-only financial advisor over one who charges commissions. For one thing, the costs may be more predictable. A financial advisor may charge a flat fee or charge by the hour. In contrast, a financial advisor who works on commission may suggest financial products that they earn commission from. In addition, many fee-only advisors are fiduciaries, which means they are obligated to act in the client’s best interests at all times.
Each investor should find out the specific fees involved relating to their investment. And don’t be afraid to ask questions. It’s critical to know exactly what you’ll be paying and what those costs cover.
How Much Is Too High a Price To Invest?
The cost of investment fees varies widely, depending on the type of fee. Advisory fees of more than 1% may be considered too high a price for many investors. Sales charges typically range between 3% and 6%, so anything higher than that might be something to avoid.
Of funds that charge fees, broad-index ETFs and mutual funds often charge the lowest fees.
The Takeaway
No matter how an investor gets into the market, they will pay some kind of fee. It may be the quarterly deduction made by a financial advisor, or the trading costs and account fees of an online brokerage account, or the regularly deducted management fees of a mutual fund.
Those fees and commissions add up to the “cost of investment.” That cost is deducted from assets and represents a drag on any return an investor may earn over time. As such, investing fees require close attention, regardless of an investor’s strategy or long-term goals.
Invest in what matters most to you with SoFi Active Invest. In a self-directed account provided by SoFi Securities, you can trade stocks, exchange-traded funds (ETFs), mutual funds, alternative funds, options, and more — all while paying $0 commission on every trade. Other fees may apply. Whether you want to trade after-hours or manage your portfolio using real-time stock insights and analyst ratings, you can invest your way in SoFi's easy-to-use mobile app.
Opening and funding an Active Invest account gives you the opportunity to get up to $1,000 in the stock of your choice.¹
FAQ
What are typical investment fees?
Typical investment fees include broker fees, trading fees, sales charges, management fees, and advisory fees.
Investment fees tend to be structured either as recurring fees, in which the charges are a percentage of the assets you’ve invested, or as one-time transaction charges that are similar to a flat fee, such as a certain amount of money per-trade.
Is a 1% management fee high?
A 1% management fee is a fairly typical fee. However, even though it is standard, you can try negotiating for a smaller fee than 1%. Some financial advisors may be willing to lower the percentage.
How much should you pay for investment management fees?
Generally, you can expect to pay about 1% for an investment management fee. Overall, percentage fees like this tend to be best for investors with smaller investments, while a flat fee tends to be more advantageous to investors with a very large investment (meaning more than $1 million).
INVESTMENTS ARE NOT FDIC INSURED • ARE NOT BANK GUARANTEED • MAY LOSE VALUE
SoFi Invest is a trade name used by SoFi Wealth LLC and SoFi Securities LLC offering investment products and services. Robo investing and advisory services are provided by SoFi Wealth LLC, an SEC-registered investment adviser. Brokerage and self-directed investing products offered through SoFi Securities LLC, Member FINRA/SIPC.
For disclosures on SoFi Invest platforms visit SoFi.com/legal. For a full listing of the fees associated with Sofi Invest please view our fee schedule.
Financial Tips & Strategies: The tips provided on this website are of a general nature and do not take into account your specific objectives, financial situation, and needs. You should always consider their appropriateness given your own circumstances.
¹Probability of Member receiving $1,000 is a probability of 0.026%; If you don’t make a selection in 45 days, you’ll no longer qualify for the promo. Customer must fund their account with a minimum of $50.00 to qualify. Probability percentage is subject to decrease. See full terms and conditions.
Disclaimer: The projections or other information regarding the likelihood of various investment outcomes are hypothetical in nature, do not reflect actual investment results, and are not guarantees of future results.
Exchange Traded Funds (ETFs): Investors should carefully consider the information contained in the prospectus, which contains the Fund’s investment objectives, risks, charges, expenses, and other relevant information. You may obtain a prospectus from the Fund company’s website or by emailing customer service at [email protected]. Please read the prospectus carefully prior to investing.
Mutual Funds (MFs): Investors should carefully consider the information contained in the prospectus, which contains the Fund’s investment objectives, risks, charges, expenses, and other relevant information. You may obtain a prospectus from the Fund company’s website or clicking the prospectus link on the fund's respective page at sofi.com. You may also contact customer service at: 1.855.456.7634. Please read the prospectus carefully prior to investing.Mutual Funds must be bought and sold at NAV (Net Asset Value); unless otherwise noted in the prospectus, trades are only done once per day after the markets close. Investment returns are subject to risk, include the risk of loss. Shares may be worth more or less their original value when redeemed. The diversification of a mutual fund will not protect against loss. A mutual fund may not achieve its stated investment objective. Rebalancing and other activities within the fund may be subject to tax consequences.
Third Party Trademarks: Certified Financial Planner Board of Standards Center for Financial Planning, Inc. owns and licenses the certification marks CFP®, CERTIFIED FINANCIAL PLANNER®
This article is not intended to be legal advice. Please consult an attorney for advice.