hand holding smartphone on yellow background

What Is Considered a Good Return on Investment?

A “good” return on investment is subjective, but in a very general sense, a good return on investment could be considered to be about 7% per year, based on the average historic return of the S&P 500 index, and adjusting for inflation. But of course what one investor considers a good return might not be ideal for someone else.

And while getting a “good” return on your investments is important, it’s equally important to know that the average return of the U.S. stock market is just that: an average of the market’s performance, typically going back to the 1920s. On a year-by-year basis, investors can expect returns that might be higher or lower — and they also have to face the potential for outright losses. In addition, the S&P 500 is a barometer of the equity markets, and it only reflects the performance of the 500 biggest companies in the U.S. Most investors will hold other types of securities in addition to equities, which can affect their overall portfolio return.

Key Points

•   A good return on investment is generally considered to be around 7% per year, based on the average historic return of the S&P 500 index, adjusted for inflation.

•   The average return of the U.S. stock market is around 10% per year, adjusted for inflation, dating back to the late 1920s.

•   Different investments, such as CDs, bonds, stocks, and real estate, offer varying rates of return and levels of risk.

•   It’s important to consider factors like diversification and time when investing long-term.

•   Investing in stocks carries higher potential returns but also higher risk, while investments like CDs offer lower returns but are considered lower-risk.

What Is the Historical Average Stock Market Return?

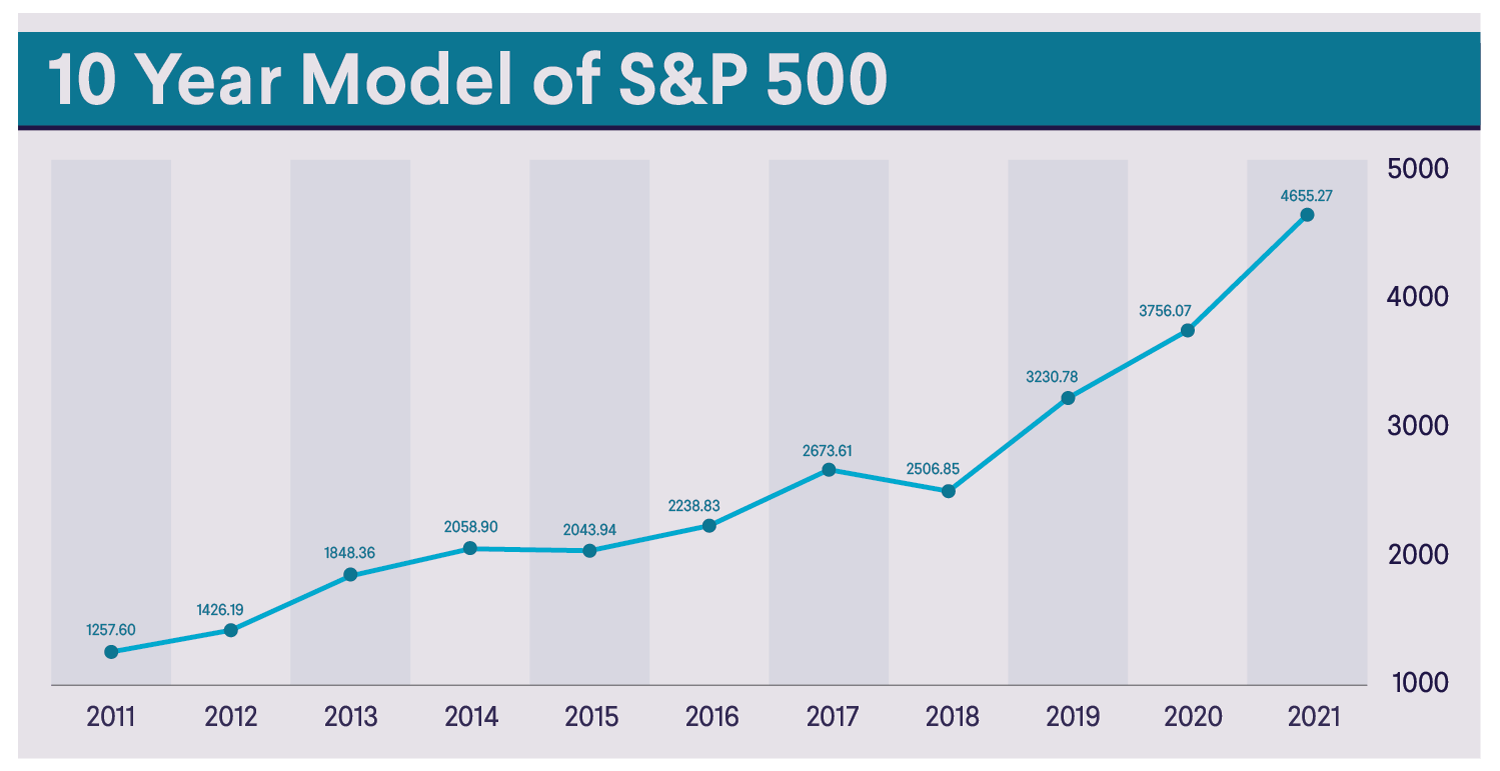
Dating back to the late 1920s, the S&P 500 index has returned, on average, around 10% per year. Adjusted for inflation that’s roughly 7% per year.

Here’s how much a 7% return on investment can earn an individual after 10 years: If an individual starts out by putting in $1,000 into an investment with a 7% average annual return, compounded annually, they would see their money grow to $1,967 after a decade, assuming little or no volatility (which is unlikely in real life). It’s important for investors to have realistic expectations about what type of return they’ll see.

For financial planning purposes however, investors interested in buying stocks should keep in mind that that doesn’t mean the stock market will consistently earn them 7% each year. In fact, S&P 500 share prices have swung violently throughout the years. For instance, the benchmark tumbled 38% in 2008, then completely reversed course the following March to end 2009 up 23%.

Factors such as economic growth, corporate performance, interest rates, and share valuations can affect stock returns. Thus, it can be difficult to say X% or Y% is a good return, as the investing climate varies from year to year.

A better approach is to think about your hoped-for portfolio return in light of a certain goal (e.g. retirement), and focus on the investment strategy that might help you achieve that return.

Line graph: 10 Year Model of S&P 500

Why Your Money Might Lose Value If You Don’t Invest it

It’s helpful to consider what happens to the value of your money if you simply hang on to cash.

Keeping cash can feel like a lower-risk alternative to investing, so it may seem like a good idea to deposit your money into a traditional savings account. But cash slowly loses value over time due to inflation; that is, the cost of goods and services increases with time, meaning that cash has less purchasing power. Inflation can also impact your investments.

Interest rates are important, too. Putting money in a savings account that earns interest at a rate that is lower than the inflation rate guarantees that money will lose value over time. This is why, despite the risks, investing money is often considered a better alternative to simply saving it: The inflation risk is typically lower.

Get up to $1,000 in stock when you fund a new Active Invest account.*

Access stock trading, options, alternative investments, IRAs, and more. Get started in just a few minutes.


*Customer must fund their Active Invest account with at least $50 within 45 days of opening the account. Probability of customer receiving $1,000 is 0.026%. See full terms and conditions.

What Is a Good Rate of Return for Various Investments?

As noted above, determining a good rate of return will also depend on the specific investments you hold, and your asset allocation. You can always calculate the expected rate of return for various securities. Here are different types of securities to consider.

Bonds

Purchasing a bond is basically the same as loaning your money to the bond-issuer, like a government or business. Similar to a CD, a bond is a way of locking up a certain amount of money for a fixed period of time.

Here’s how it works: A bond is purchased for a fixed period of time (the duration), investors receive interest payments over that time, and when the bond matures, the investor receives their initial investment back.

Generally, investors earn higher interest payments when bond issuers are riskier. An example may be a company that’s struggling to stay in business. But interest payments may be lower when the borrower is trustworthy, like the U.S. government, which has never defaulted on its Treasuries.

Stocks

Stocks can be purchased in a number of ways. But the important thing to know is that a stock’s potential return will depend on the specific stock, when it’s purchased, and the risk associated with it. Again, the general idea with stocks is that the riskier the stock, the higher the potential return.

This doesn’t necessarily mean you can put money into the market today and assume you’ll earn a large return on it in the next year. But based on historical precedent, your investment may bear fruit over the long-term. Because the market on average has gone up over time, bringing stock values up with it, but stock investors have to know how to handle a downturn.

As mentioned, the stock market averages a return of roughly 7% per year, adjusted for inflation.

Real Estate

Returns on real estate investing vary widely. It mostly depends on the type of real estate — if you’re purchasing a single house versus a real estate investment trust (REIT), for instance — and where the real estate is located.

As with other investments, it all comes down to risk. The riskier the investment, the higher the chance of greater returns and greater losses. Investors often debate the merit of investing in real estate versus investing in the market.

Likely Return on Investment Assets

For investors who have a high risk tolerance (they’re willing to take big risks to potentially earn high returns), some investments are better than others. So for those who are looking for higher returns, adding riskier investments to a portfolio may be worth considering.

Remember the Principles of Good Investing

Investors focused on seeing huge returns over the short-term may set themselves up for disappointment. Instead, remembering basic tenets of responsible investing can best prepare an investor for long-term success.

First up: diversification. It can be a good idea to invest in a wide variety of assets — stocks, bonds, real estate, etc., and a wide variety of investments within those subgroups. That’s because each type of asset tends to react differently to world events and market forces. Due to that, a diverse portfolio can be a less risky portfolio. Time is another important factor when investing. Investing early for more distant goals, such as retirement, may result in larger returns in the long-term.


Test your understanding of what you just read.


The Takeaway

While every investor wants a “good return” on their investments, there isn’t one way to achieve a good return – and different investments have different rates of return, and different risk levels. Investing in other types of assets tends to deliver lower returns, while stocks (which are more volatile) may deliver higher returns but at much greater risk.

Your own investing strategy and asset allocation will have an influence on the potential returns of your portfolio over time.

Invest in what matters most to you with SoFi Active Invest. In a self-directed account provided by SoFi Securities, you can trade stocks, exchange-traded funds (ETFs), mutual funds, alternative funds, options, and more — all while paying $0 commission on every trade. Other fees may apply. Whether you want to trade after-hours or manage your portfolio using real-time stock insights and analyst ratings, you can invest your way in SoFi's easy-to-use mobile app.

Opening and funding an Active Invest account gives you the opportunity to get up to $1,000 in the stock of your choice.¹


INVESTMENTS ARE NOT FDIC INSURED • ARE NOT BANK GUARANTEED • MAY LOSE VALUE

SoFi Invest is a trade name used by SoFi Wealth LLC and SoFi Securities LLC offering investment products and services. Robo investing and advisory services are provided by SoFi Wealth LLC, an SEC-registered investment adviser. Brokerage and self-directed investing products offered through SoFi Securities LLC, Member FINRA/SIPC.

For disclosures on SoFi Invest platforms visit SoFi.com/legal. For a full listing of the fees associated with Sofi Invest please view our fee schedule.

Financial Tips & Strategies: The tips provided on this website are of a general nature and do not take into account your specific objectives, financial situation, and needs. You should always consider their appropriateness given your own circumstances.

S&P 500 Index: The S&P 500 Index is a market-capitalization-weighted index of 500 leading publicly traded companies in the U.S. It is not an investment product, but a measure of U.S. equity performance. Historical performance of the S&P 500 Index does not guarantee similar results in the future. The historical return of the S&P 500 Index shown does not include the reinvestment of dividends or account for investment fees, expenses, or taxes, which would reduce actual returns.

¹Probability of Member receiving $1,000 is a probability of 0.026%; If you don’t make a selection in 45 days, you’ll no longer qualify for the promo. Customer must fund their account with a minimum of $50.00 to qualify. Probability percentage is subject to decrease. See full terms and conditions.

SOIN-Q125-034

Read more
What Are the 11 S&P 500 Sectors?

Guide to the Sectors of the S&P 500 and Their Weights

The S&P sectors represent the different categories that the index uses to sort the companies it follows. There are 11 sectors that make up the S&P 500, and they include health care, technology, energy, real estate, and more.

Understanding how the S&P sectors work and break down further can help both institutional and retail investors manage risk through different economic cycles by allocating their portfolio across multiple sectors. For example, cyclical stocks and cyclical sectors tend to fare well when the economy booms. During a recession, however, defensive stocks may outperform them. However, it’s also possible for all 11 sectors to trend in the same direction.

Key Points

•   The S&P 500 is divided into 11 sectors, including technology, healthcare, and financials, which help categorize the largest U.S. companies.

•   Technology is the largest sector, reflecting significant growth and market influence from major companies like Apple and Microsoft.

•   Utilities is the smallest sector, comprising just over 2% of the index, highlighting its smaller market impact compared to other areas.

•   Sector weighting in the S&P 500 is dynamic, changing with the economic influence and size of constituent companies.

•   Understanding these sectors aids investors in diversifying portfolios and strategizing investments based on economic conditions and market trends.

What Is the S&P 500

“S&P” refers to Standard & Poor, and the S&P 500 index tracks the movements of 500 large-cap U.S. companies. A number of mutual funds and exchange-traded funds (ETFs) use this index as a benchmark.

Many investors use the S&P 500 as a stand-in for the entire market when it comes to investing, particularly index investing. But again, the S&P 500 can be broken down into specific sectors in which companies of particular types are concentrated — allowing investors to get more granular, if they wish, with their investment strategies.

💡 Quick Tip: For investors who want a diversified portfolio without having to manage it themselves, automated investing could be a solution (although robo advisors typically have more limited options and higher costs). The algorithmic design helps minimize human errors, to keep your investments allocated correctly.

Examining the 11 Sectors of the S&P

The Global Industry Classification System (GICS) has 11 stock market sectors in its taxonomy. It further breaks down these 11 sectors into 24 industry groups, 74 industries, and 163 sub-industries. Here’s a look at the S&P Sector list, by size:

1. Technology

Technology is the largest sector of the S&P 500. This sector includes companies involved in the development, manufacturing, or distribution of tech-related products and services. For example, companies in the technology sector may produce computer software programs or electronics hardware, or research and develop new technologies.

Tech stock investments are typically cyclical, in that they usually perform better during economic expansions. The technology sector includes a number of growth stocks, which are companies that reinvest most or all of their profits in expansion versus paying dividends. Examples of some popular tech stocks include:

•   Facebook (META)

•   Apple (AAPL)

•   Microsoft (MSFT)

•   Alphabet (GOOG)

•   IBM (IBM)

2. Financials

The financials sector covers a variety of industries, including banking and investing. Banks, credit unions, mortgage companies, wealth management firms, credit card companies and insurance companies are all part of the financial sector.

Financial services companies are usually categorized as cyclical. For example, a credit card issuer’s profit margins may shrink during a recession if unemployment rises and people spend less or can not keep up with credit card payments. But this can be subjective, as mortgage companies may benefit during recessionary periods if lower interest rates spur home-buying activity.

Some of the biggest names in the financial sector include:

•   Visa (V)

•   JPMorgan Chase (JPM)

•   Bank of America (BAC)

•   PayPal Holdings (PYPL)

•   Mastercard (MA)

3. Health Care

The next largest of the S&P sectors is health care. This sector includes pharmaceutical companies, companies that produce or distribute medical equipment, and supplies and companies that conduct health care-related research.

The health care sector also includes alternative health companies, including companies that use cannabis as a part of their medical research and product development.

Recommended: Cannabis Investing 101

More traditional examples of healthcare sector companies include:

•   CVS (CVS)

•   Johnson & Johnson (JNJ)

•   UnitedHealth Group (UNH)

•   Thermo Fisher Scientific (TMO)

•   Regeneron (REGN)

Health care stocks are typically non-cyclical, as demand for these products and services usually doesn’t hinge on economic movements.

4. Consumer Discretionary

The consumer discretionary sector is a largely cyclical sector that includes companies in the hospitality and entertainment sectors, as well as retailers.

Examples of stocks that fit into the consumer discretionary sector are:

•   Starbucks (SBUX)

•   AMC (AMC)

•   Best Buy (BBY)

•   Home Depot (HD)

•   Nike (NKE)

Generally, these companies represent things consumers may spend more money on in a thriving economy and cut back on during a downturn. That’s why they’re considered cyclical in nature.

5. Communications Services

This sector spans companies that provide communications services of some kind. That can include landline phone services, cellular phone services, or internet services. Communications also includes companies responsible for producing movies and television shows.

The communications sector can be hard to pin down in terms of whether it’s cyclical or defensive. In a down economy, for example, people may continue to spend money on phone and internet services but cut back on streaming services. So there’s an argument to be made that the communication sector is a little of both.

Companies that belong to this sector include:

•   Comcast (CMCSA)

•   AT&T (T)

•   Dish Network (DISH)

•   Discovery Communications (WBD)

•   Activision Blizzard (ATVI)

Get up to $1,000 in stock when you fund a new Active Invest account.*

Access stock trading, options, alternative investments, IRAs, and more. Get started in just a few minutes.


*Customer must fund their Active Invest account with at least $50 within 45 days of opening the account. Probability of customer receiving $1,000 is 0.026%. See full terms and conditions.

6. Industrials

The industrial sector covers a broad range of industries, including those in the manufacturing and transportation sectors. For example:

•   Honeywell (HON)

•   3M (MMM)

•   Stanley Black & Decker (SWK)

•   Delta Airlines (DAL)

•   Boeing (BA)

Industrials are often considered to be cyclical stocks, again because of how they react to changes in supply and demand. The airline industry, for example, saw a steep decline in 2020 as air travel was curtailed due to the coronavirus pandemic.

7. Consumer Staples

Consumer staples stocks represent things consumers regularly spend money on. That includes groceries, household products and personal hygiene products. The consumer staples sector is also a defensive sector because even when the economy hits a rough spot, consumers will continue spending money on these things.

From an investment perspective, consumer staples stocks may not yield the same return profile as other sectors. But they may provide some stability in a portfolio when the market gets shaky.

Companies that are recognized as some of the top consumer staples stocks include:

•   General Mills (GIS)

•   Coca-Cola (KO)

•   Procter & Gamble (PG)

•   Conagra Brands (CAG)

•   Costco Wholesale (COST)

8. Energy

The energy sector includes companies that participate in the production and/or distribution of energy. That includes the oil and gas industry as well as companies connected to the development or distribution of renewable energy sources.

Energy stock investments can be more sensitive to economic movements and supply-demand trends compared to other sectors.

Some of the biggest energy sector companies include:

•   Exxon Mobil (XOM)

•   Royal Dutch Shell (SHEL)

•   Chevron (CVX)

•   Conocophillips (COP)

•   Halliburton (HAL)

9. Real Estate

This sector includes real estate investment trusts (REITs) as well as realtors, developers and property management companies. REITs invest in income-producing properties and may pay out as much as 90% of profits out to investors as dividends.

Investing in real estate can be a defensive move as this sector is largely uncorrelated with stocks. So if stock prices fall, for example, investors may not see a correlating drop in real estate investments as property generally tends to appreciate over time.

Examples of real estate companies in the S&P 500 include:

•   Digital Realty (DLR)

•   American Tower (AMT)

•   Prologis (PLD)

•   Simon Property Group (SPG)

•   Boston Properties (BXP)

10. Materials

The materials sector includes companies connected to the sourcing, processing or distribution of raw materials. That includes things like lumber, concrete, glass, and other building materials.

Materials is one of the cyclical S&P sectors, as it can be driven largely by supply and demand. During a housing boom, for example, the materials sector may benefit from increased demand for lumber, plywood and other construction materials.

Material stocks in the S&P 500 include:

•   Dupont (DD)

•   Celanese (CE)

•   Sherwin Williams (SHW)

•   Air Products & Chemicals (APD)

•   Eastman Chemical (EMN)

11. Utilities

Utilities represent one of the core defensive S&P sectors. This sector includes companies that provide gas, electricity, water, and other utilities to households, businesses, farms, and other entities.

Since these are essentials that people typically can’t do without, they’re generally less sensitive to major shifts in the economic cycle. They also often pay dividends to their investors.

Examples of utilities stocks include:

•   AES (AES)

•   UGI (UGI)

•   CenterPoint Energy (CNP)

•   Duke Energy (DUK)

•   Dominion Energy (D)

Recommended: How to Invest in Utilities

How Are the Sectors of the S&P 500 Weighted?

Given that the S&P 500 is composed mostly of the largest companies, its weighting is relative to the size of those companies and their respective industries. As such, that’s why technology, health care, and financials are relatively large compared to other sectors.

It’s also important to understand that things change over time — in terms of company and industry size and influence on the overall economy. Accordingly, the index itself changes, and weighting of specific sectors and companies changes as well.

Which Is the Largest S&P 500 Sector?

As discussed, technology, or information and technology, is currently the largest sector in the S&P 500. That’s in large part due to the tech sector’s growth over the past couple of decades, and certain companies within the sector becoming larger with massive market caps — companies such as Apple, Microsoft, Alphabet, Meta, Netflix, and others.

Which Is the Smallest S&P 500 Sector?

As of March 2024, utilities is the smallest S&P 500 sector, comprising a little more than 2% of the overall index. But the materials and real estate sectors are not much bigger.

💡 Quick Tip: When you’re actively investing in stocks, it’s important to ask what types of fees you might have to pay. For example, brokers may charge a flat fee for trading stocks, or require some commission for every trade. Taking the time to manage investment costs can be beneficial over the long term.

What Can You Do As an Investor With This Information?

Investors can tap their knowledge of the S&P 500 sectors to help inform their investing strategy and plan. As discussed, while some sectors tend to be a bit more volatile, investors may look at specific and strategic allocations in other sectors to help “smooth” things out during times of volatility in the market.

Further, sector investing can help investors diversify their portfolios, or find additional opportunities to invest.


Test your understanding of what you just read.


The Takeaway

Knowing what the S&P sectors are and which types of industries or sub-industries they represent can help investors achieve diversification through different types of investments. While some financial experts liken the sectors to a pie, with several individual slices, it may be more helpful to think of them as a buffet from which investors can pick and choose.

You can either purchase stocks within or across sectors, or look for funds that can provide that diversification for you. It’ll all depend on your overall financial plan and investment strategy. If you need help honing that in, it may be beneficial to speak with a financial professional.

Invest in what matters most to you with SoFi Active Invest. In a self-directed account provided by SoFi Securities, you can trade stocks, exchange-traded funds (ETFs), mutual funds, alternative funds, options, and more — all while paying $0 commission on every trade. Other fees may apply. Whether you want to trade after-hours or manage your portfolio using real-time stock insights and analyst ratings, you can invest your way in SoFi's easy-to-use mobile app.

Opening and funding an Active Invest account gives you the opportunity to get up to $1,000 in the stock of your choice.¹

FAQ

What are the S&P 500 sector weights?

As of March 2024, information technology is the largest sector in the S&P 500, comprising nearly 30% of the overall index. It’s followed by financials at 13%, health care at 12.5%, and consumer discretionary at 10.6%.

What is the sector breakdown of the S&P 500?

The eleven sectors of the S&P 500 are information technology, financials, health care, consumer discretionary, communication services, industrials, consumer staples, energy, real estate, materials, and utilities.

What is the smallest sector of the S&P 500?

As of March 2024, utilities is the smallest sector of the S&P 500, comprising 2.1% of the overall index.


About the author

Rebecca Lake

Rebecca Lake

Rebecca Lake has been a finance writer for nearly a decade, specializing in personal finance, investing, and small business. She is a contributor at Forbes Advisor, SmartAsset, Investopedia, The Balance, MyBankTracker, MoneyRates and CreditCards.com. Read full bio.


Photo credit: iStock/izusek

INVESTMENTS ARE NOT FDIC INSURED • ARE NOT BANK GUARANTEED • MAY LOSE VALUE

SoFi Invest is a trade name used by SoFi Wealth LLC and SoFi Securities LLC offering investment products and services. Robo investing and advisory services are provided by SoFi Wealth LLC, an SEC-registered investment adviser. Brokerage and self-directed investing products offered through SoFi Securities LLC, Member FINRA/SIPC.

For disclosures on SoFi Invest platforms visit SoFi.com/legal. For a full listing of the fees associated with Sofi Invest please view our fee schedule.

Financial Tips & Strategies: The tips provided on this website are of a general nature and do not take into account your specific objectives, financial situation, and needs. You should always consider their appropriateness given your own circumstances.

Exchange Traded Funds (ETFs): Investors should carefully consider the information contained in the prospectus, which contains the Fund’s investment objectives, risks, charges, expenses, and other relevant information. You may obtain a prospectus from the Fund company’s website or by emailing customer service at [email protected]. Please read the prospectus carefully prior to investing.

Investment Risk: Diversification can help reduce some investment risk. It cannot guarantee profit, or fully protect in a down market.


¹Probability of Member receiving $1,000 is a probability of 0.026%; If you don’t make a selection in 45 days, you’ll no longer qualify for the promo. Customer must fund their account with a minimum of $50.00 to qualify. Probability percentage is subject to decrease. See full terms and conditions.

SOIN0324001

Read more
How to Calculate Rate of Return

Rate of Return (RoR): Formula and Calculation Examples

Calculating rate of return, as it relates to investing, is a way for investors or traders to get a sense of how much money they stand to gain or lose from their investments. It’s a relatively simple formula and calculation, and can help investors evaluate their overall performance in the markets. It does have some shortcomings, however, such as not accounting for the time value of money or the timing of cash flows. So, there are alternative calculations out there to help get even more accurate results.

Key Points

•   The Rate of Return (RoR) measures an investment’s gain or loss as a percentage of its initial value over a specific period.

•   Calculating RoR involves identifying the initial and end values, applying the formula, and can be done manually or using tools like Excel.

•   RoR helps investors evaluate investment performance, compare different investments, and make informed decisions about resource allocation.

•   Understanding RoR is crucial for assessing investment performance, aligning with financial goals, and determining market performance relative to other opportunities.

What Is Rate of Return?

Rate of return (RoR) is a measure of an investment’s gain or loss, expressed as a percentage of its initial value, over a given period of time. If calculated correctly, your rate of return will be expressed as a percentage of your initial investment. Positive rate of return calculations indicate a net gain on your investment, while negative results will indicate a loss.

Don’t confuse this with the expected rate of return, which forecasts your expected returns using probability and historical performance.

When using the rate of return formula, your chosen time period is referred to as your “holding period.” Regardless of whether your holding period lasts days, months, or even years. It’s important that you keep the time periods consistent when comparing investment performance.

How to Calculate Rate of Return

You can calculate the rate of return on your online investing or other type of investing activity by comparing the difference between its current value and its initial value, and then dividing the result by its initial value.

Multiplying the result of that rate of return formula by 100 will net you your rate of return as a percentage. You’ll know whether you made money on your investment depending on whether your result comes in as positive or negative.

Rate of Return Formula

The standard rate of return formula can be represented as follows:

R = [ ( Ve – Vb ) / Vb ] x 100

In this equation:

R = Rate of return

Ve = End of period value

Vb = Beginning of period value

The aforementioned formula can be applied to any holding period to find your rate of return “R” over that timespan.

“Ve,” your end of period value, should represent the value of your investment, including any interest or dividends earned over your holding period.

Finally “Vb” should represent the value of your initial investment. It will be used as the relative basis on which your investment returns are calculated.

Get up to $1,000 in stock when you fund a new Active Invest account.*

Access stock trading, options, alternative investments, IRAs, and more. Get started in just a few minutes.


*Customer must fund their Active Invest account with at least $50 within 45 days of opening the account. Probability of customer receiving $1,000 is 0.026%. See full terms and conditions.

Example of Calculating Rate of Return

To help you understand how to calculate the rate of return, we’ll walk you through an example. Again, here’s the formula:

R = [ ( Ve – Vb ) / Vb ] x 100

Let’s say an investor buys an investment for $125 a share which pays no dividends. This $125 investment will be your beginning of period value (“Vb”).

After one year, the value of the investment rises to $150 and the investor chooses to sell it. Given that $150 represents the value of the investment at the end of the holding period, $150 will be your end of period value (“Ve”).

To calculate the rate of return, enter the values for Vb and Ve into the rate of return formula. With the correct values in place, your equation should look like this:

R = [ ( $150 – $125 ) / $125 ] X 100

Solving out this formula using order of operations, your calculations should proceed as follows:

R = [ $25 / $125 ] X 100

R = 0.2 X 100

R = 20%

If done correctly, the formula should calculate a one year rate of return of 20%, based on the beginning and end of period values provided.

Considerations When Using Rate of Return

The main advantages of the rate of return calculation is that it’s simple and easy to calculate. It gives you a straightforward method to measure the profitability of an investment over any time period.

However, its simplicity does result in some shortcomings, particularly when it comes to more complex investments with numerous cash flows. We dive into these limitations below.

Recommended: What Is a Good Rate of Return?

What are the Limitations of Simple Rate of Return?

The main limitations of the simple rate of return calculation are that it ignores the time value of money and timing of cash flows.

The time value of money is an important concept when it comes to finance, as it explains that money today is always worth more than the same sum of money paid in the future. This is due to the inherent earnings potential of cash held now.

In tandem with the concept above, the simple rate of return calculation also fails to account for the timing of cash flows.

Cash flows are particularly important when dealing with more complex portfolios or investments that might have multiple reinvestment periods over time or multiple dividend payouts.

The simple rate of return calculation, in some ways, oversimplifies the rate of return into a simple accounting measure over an arbitrary amount of time. To address these shortcomings, professionals typically use alternate measures like internal rate of rate (IRR) and annualized rate of return.

Annualized Rate of Return Formula

The annualized rate of return is a slightly more complicated formula that solves the compatibility issues of the simple rate of return calculation by standardizing all calculations over an annual period.

The annualized rate of return formula can be exhibited as follows.

Ra = ( Ve / Vb ) 1 / n – 1 X 100

Where,

Ra = Annualized Rate of Return

Ve = End of period value

Vb = Beginning of period value

n = number of years in holding period

Annualized rate of return (Ra) standardizes your rate of return on an annual basis; this allows you to make fair comparisons with other annualized performance figures.

“Ve,” your end of period value, represents the value of your investment at the end of the holding period, including any interest or dividends earned.

“Vb” represents the value of your initial investment.

Other Types of Return Formulas

There are a multitude of other return metrics that can help you evaluate performance.

While the calculations for these metrics fall outside the scope of this reading, we touch on some of the most commonly used ones and why they’re used.

•   Internal Rate of Return (IRR): This represents the expected annual compound growth rate of a specific investment and is usually used to help determine whether an investment is worthwhile.

•   Return on Invested Capital (ROIC): Measures a firm’s profitability in relation to the total debt and equity invested by stakeholders.

•   Return on Equity (ROE): Measures a firm’s net income in relation to the total value of its shareholder’s equity.

How Investors Can Use Rate of Return

Retail investors, institutional investors, and even corporate decision makers use the rate of return to gauge the performance of their investments over time. It’s useful when compared against a benchmark index, return expectations, or other investment options to gauge how your investment performed on a relative basis.

When comparing investment returns, it’s important to make sure you’re making fair comparisons to ensure you’re making apples-to-apples comparisons. For example, the S&P 500 might not serve as a fair benchmark for a portfolio invested 100% in international equities, as these are substantially different investment types. Benchmark comparisons give meaning to your rate of return and help you evaluate whether you’re outperforming on a relative basis.


Test your understanding of what you just read.


The Takeaway

Knowing how to calculate your rate of return gives you a useful tool for evaluating your investments’ performance. The best part about the rate of return calculation is that it can be done over almost any timespan, provided the returns you’re trying to compare have the same holding period.

Investors can calculate rate of return by hand, or by using an online spreadsheet. The same is true for annualized rate of return — which helps to standardize return rates over longer periods. Those are fairly simple ways to gauge investment returns, but there are a number of other metrics that help you assess and compare investment returns, so be sure to use the tool that aligns best with what you need to know.

Invest in what matters most to you with SoFi Active Invest. In a self-directed account provided by SoFi Securities, you can trade stocks, exchange-traded funds (ETFs), mutual funds, alternative funds, options, and more — all while paying $0 commission on every trade. Other fees may apply. Whether you want to trade after-hours or manage your portfolio using real-time stock insights and analyst ratings, you can invest your way in SoFi's easy-to-use mobile app.

Opening and funding an Active Invest account gives you the opportunity to get up to $1,000 in the stock of your choice.¹


Photo credit: iStock/AleksandarNakic

INVESTMENTS ARE NOT FDIC INSURED • ARE NOT BANK GUARANTEED • MAY LOSE VALUE

SoFi Invest is a trade name used by SoFi Wealth LLC and SoFi Securities LLC offering investment products and services. Robo investing and advisory services are provided by SoFi Wealth LLC, an SEC-registered investment adviser. Brokerage and self-directed investing products offered through SoFi Securities LLC, Member FINRA/SIPC.

For disclosures on SoFi Invest platforms visit SoFi.com/legal. For a full listing of the fees associated with Sofi Invest please view our fee schedule.

Financial Tips & Strategies: The tips provided on this website are of a general nature and do not take into account your specific objectives, financial situation, and needs. You should always consider their appropriateness given your own circumstances.


¹Probability of Member receiving $1,000 is a probability of 0.026%; If you don’t make a selection in 45 days, you’ll no longer qualify for the promo. Customer must fund their account with a minimum of $50.00 to qualify. Probability percentage is subject to decrease. See full terms and conditions.

SOIN-Q424-013

Read more
SPAN Margin: How it Works, Pros & Cons

SPAN Margin: How It Works, Pros & Cons


Editor's Note: Options are not suitable for all investors. Options involve risks, including substantial risk of loss and the possibility an investor may lose the entire amount invested in a short period of time. Please see the Characteristics and Risks of Standardized Options.

Many brokerage accounts require traders to maintain a margin account when trading options, which involves depositing funds or securities as collateral to reduce the risk of potential losses.

The SPAN system determines margin requirements on options and futures trading accounts by considering key factors, such as volatility, price changes, and portfolio composition to conduct a one-day risk global assessment.

In this sense, options margin is quite different from the margin accounts used for trading stocks and other securities, where margin refers to the use of debt to increase a position.

Key Points

•   SPAN stands for Standardized Portfolio Analysis of Risk, and is used by brokerages, investment banks, and exchanges to estimate a portfolio’s worst-case risk scenario for options and futures trading.

•   The SPAN system incorporates factors like market volatility, price changes, time decay, and portfolio composition to ensure margin requirements align with a trader’s risk exposure, so there is enough collateral to cover potential losses.

•   The SPAN margin calculation evaluates risk scenarios using sophisticated algorithms that automate the margin-setting process.

•   Advantages of using SPAN include a holistic portfolio approach and potentially lower margin requirements; disadvantages involve fluctuations in daily margin requirements due to changing market conditions.

•   Though the SPAN risk assessment and modeling method was developed for the derivatives markets, it is now employed as a risk-management tool for other financial instruments as well.

What Does SPAN Stand For?

SPAN stands for standardized portfolio analysis of risk, and is a framework used by exchanges and financial institutions to ensure that options and futures traders have enough collateral to cover potential losses.

Today, many derivative exchanges use the SPAN system for risk analysis.

What Is SPAN Margin?

The SPAN margin calculation helps options traders understand risk in their portfolios, and assists brokers in managing risk by ensuring that options and futures margin traders have enough collateral in their accounts to cover potential losses.

The SPAN system relies on algorithmic calculations to estimate a portfolio’s one-day worst-case risk scenario.
SPAN margin is calculated using key inputs such as the strike price, time decay, market volatility, price changes, and position offsets, among other factors.

What Is a Stock Margin Account?

The margin in an options or futures account is different from how a stock margin account functions when making stock trades on margin. When trading stocks and other securities, margin allows traders to use leverage (i.e., borrow funds) to increase their position. The risk of using a margin account is the potential for steep losses, possibly exceeding the initial investment.

By contrast, SPAN is used by options and futures exchanges around the world to determine a trader’s one-day worst-case scenario based on their portfolio positions. This risk modeling ensures the correct amount of collateral is deposited.

Margin requirements can be determined in an automated way from the calculation’s output.

How Does SPAN Margin Work?

The SPAN margin calculation uses modeled risk scenarios to determine margin requirements on options and futures. Some key variables included in the algorithm are strike prices, risk-free interest rates, price changes in the underlying assets, volatility shifts, and the effect of time decay on options.

Not all options positions have margin requirements. Buying options, for example, typically does not require margin, while selling (or writing) options requires a deposit to mitigate potential risks.

In essence, the options seller exposes the broker to risk when they trade. To reduce the risk that the trader won’t be able to pay back the lender, margin requirements establish minimum deposits that must be kept with the broker. (This is different from the margin requirements needed in a stock trading account.)

Instead of relying on fixed or static figures, the SPAN system automates the margin-setting process, relying on sophisticated algorithms and a range of inputs. SPAN margin looks at the worst-case scenario in terms of one-day risk, so the margin requirement output will change each day.

The analysis is done from a total-portfolio perspective since all assets are considered. For example, the SPAN margin calculation can take excess margin from one position and apply it to another.

Pros and Cons of SPAN Margin

There are upsides and downsides to SPAN margin in options and futures trading.

The Advantages

The key advantage of SPAN margins is that it is intended to cover potential losses.

Net option sellers benefit from SPAN’s holistic portfolio approach. SPAN combines options positions when assessing risk. If you have an options position with a substantial risk in isolation, but another options position that offsets that risk, SPAN considers both. The effect is a potentially lower margin requirement.

On top of that, futures options exchanges that use the SPAN margin calculation allow Treasury bills to be margined.

The Downsides

Changing market conditions can result in significant fluctuations in daily margin requirements.SPAN margin isn’t without its challenges. One big drawback is how much margin requirements can shift from day to day. If the market gets volatile or prices move suddenly, you might find yourself scrambling to meet a higher margin call to keep your positions open.

Another issue is the complexity. SPAN’s calculations aren’t always easy to follow, especially for newer traders. Unlike simpler, fixed-margin systems, SPAN relies on a lot of variables, so you might not always know what to expect with your margin needs.

Although SPAN’s portfolio-wide approach is helpful, it can sometimes create confusion. Margin offsets across different positions might be hard to follow unless you’re closely tracking how everything is allocated. This makes it important to stay on top of your portfolio and understand how SPAN applies to your trades.

The Takeaway

SPAN margin is a helpful risk-management tool for options trading. Algorithms determine margin requirements based on a one-day risk analysis of a trader’s account, taking into consideration factors such as market volatility and position size.

By considering the entire portfolio, SPAN helps ensure that margin requirements are in line with a trader’s risk exposure. This provides a more dynamic, accurate approach to managing risk.

SoFi’s options trading platform offers qualified investors the flexibility to pursue income generation, manage risk, and use advanced trading strategies. Investors may buy put and call options or sell covered calls and cash-secured puts to speculate on the price movements of stocks, all through a simple, intuitive interface.

With SoFi Invest® online options trading, there are no contract fees and no commissions. Plus, SoFi offers educational support — including in-app coaching resources, real-time pricing, and other tools to help you make informed decisions, based on your tolerance for risk.

Explore SoFi’s user-friendly options trading platform.

🛈 SoFi does not offer futures trading at this time.

FAQ

What does SPAN stand for in margin trading?

SPAN margin stands for “standardized portfolio analysis of risk.” It is a system used by many options and futures exchanges worldwide to gauge a portfolio’s risk level, and ensure that the trader has enough collateral to cover potential losses.

How is SPAN margin used?

SPAN margin is used to manage risk. It calculates the amount of good-faith deposit a trader must add to their account in order to engage in options or futures trading. To help ensure that traders maintain adequate collateral for their positions, mitigating risks to the broker, exchanges use the SPAN system to calculate a worst possible one-day outcome and set a margin requirement accordingly.

What is a SPAN calculation?

SPAN is calculated using risk assessments. That means an array of possible outcomes is analyzed based on different market conditions using the assets in a portfolio. These risk scenarios specify certain changes in variables such as price changes, volatility shifts, and decreasing time to expiration in options trading.


Photo credit: iStock/NakoPhotography

INVESTMENTS ARE NOT FDIC INSURED • ARE NOT BANK GUARANTEED • MAY LOSE VALUE

SoFi Invest is a trade name used by SoFi Wealth LLC and SoFi Securities LLC offering investment products and services. Robo investing and advisory services are provided by SoFi Wealth LLC, an SEC-registered investment adviser. Brokerage and self-directed investing products offered through SoFi Securities LLC, Member FINRA/SIPC.

For disclosures on SoFi Invest platforms visit SoFi.com/legal. For a full listing of the fees associated with Sofi Invest please view our fee schedule.

Options involve risks, including substantial risk of loss and the possibility an investor may lose the entire amount invested in a short period of time. Before an investor begins trading options they should familiarize themselves with the Characteristics and Risks of Standardized Options . Tax considerations with options transactions are unique, investors should consult with their tax advisor to understand the impact to their taxes.

Disclaimer: The projections or other information regarding the likelihood of various investment outcomes are hypothetical in nature, do not reflect actual investment results, and are not guarantees of future results.

Financial Tips & Strategies: The tips provided on this website are of a general nature and do not take into account your specific objectives, financial situation, and needs. You should always consider their appropriateness given your own circumstances.


¹Probability of Member receiving $1,000 is a probability of 0.026%; If you don’t make a selection in 45 days, you’ll no longer qualify for the promo. Customer must fund their account with a minimum of $50.00 to qualify. Probability percentage is subject to decrease. See full terms and conditions.

SOIN-Q125-097

Read more
overhead view of businessman working, looking at business charts and graphs

Guide to Share Lending

Share lending is when investment firms loan shares to borrowers as a way to collect additional revenue on stocks they already hold. This produces another revenue stream on equities that would otherwise sit untraded in their portfolios.

The borrowers of the shares are often short sellers, who give collateral in the form of cash or other securities to the lenders.

Key Points

•   Share lending involves institutional investors temporarily transferring shares to borrowers for a fee, enhancing revenue.

•   Short selling, a key use of borrowed shares, is a high-risk strategy that allows investors to seek potentially high returns from price declines and increased market liquidity.

•   Benefits of share lending include additional income and turning inactive investments into potential profit generators.

•   Risks include counterparty default, loss of SIPC protection, negative tax implications, and loss of voting rights.

•   Concerns exist over the transfer of voting rights and lack of transparency in the securities lending market.

What Is Share Lending?

Share lending involves institutions lending out investors’ shares of stock to other investors in order to generate more revenue. The lenders are often pension funds, mutual funds, sovereign wealth funds, and exchange-traded fund (ETF) providers, since these types of firms tend to be long-term holders of equities.

Brokerages can also practice securities lending with shares in retail investors’ brokerage accounts, so long as investors agree to it. Share lending can help such firms keep management fees down for their clients.

Share lending is also known as securities lending, as the practice can extend beyond equities to bonds and commodities. Securities lending has become more popular in recent years as increased competition in the brokerage space drove down management fees to near-zero, and investment firms sought other sources of revenue. Worldwide revenue from securities lending totaled $9.64 billion during 2024.

Share lending is also useful to investors who are shorting stock, because those investors need to borrow shares in order to open their positions.

Critics argue that the practice comes at the expense of fund investors, since investment firms forgo their voting rights when they loan out shares. They might also try to own stocks that are easier to rent out.

Other concerns about share lending include a lack of transparency, and an increase in counterparty risk. That said, because short-sellers often use margin trading as a way to increase their potential returns, they’re likely used to assuming risk.

How Securities Lending Works

Here’s a deeper breakdown of how share lending works:

1.    Institutional investors use in-house or third-party agents to match their shares with borrowers. Such agents receive a cut of the fee generated by the loan. Sometimes, retail investors may loan or borrower shares through their broker as well.

2.    The fee is agreed upon in advance and typically tied to how much demand there is for the lent-out security on the market.

3.    The institutional investor or lender often reinvests the collateral in order to collect additional interest or income while their shares are out on loan.

4.    Borrowers tend to be other banks, hedge funds, or broker-dealers, and sometimes include other lending agents, retail investors, or short sellers. When the borrower is done using the shares, they return them back to the lender.

5.    If the collateral posted was in the form of cash, a percentage of the revenue earned from reinvesting is sometimes given back to the borrower.

Retail investors should learn whether their brokerage offers securities lending or share-lending programs. If you have a margin account at a brokerage or with a specific investing platform, there’s a good chance that you may be eligible or given access to a share-lending program. But you’ll need to ask your specific brokerage for details.

For some dividend stocks, investors could get some form of payment from the borrower, rather than the dividend itself. This payment may be taxed at a higher rate than a dividend payout.

Share Lending and Short Selling

In order to short a stock, investors usually first borrow shares. They then sell these shares to another investor or trader, with the hope that when or if the stock’s price falls, the short seller can buy them back and pocket the difference, before returning the loaned shares.

In share lending, a share can only be loaned out once — but when the borrower is a short seller, they can sell it, and the new buyer can lend it again. This is why the short stock float – the percentage of the share float that is shorted — can rise above 100% in a stock.

The fee generated by lending out shares depends on their availability. A small number of stocks tend to account for a large proportion of revenue in securities lending.

Criticism of Securities Lending

The lack of transparency in securities lending is a concern for many investors — both retail, and institutional.

The Dark Side of Share Lending

In December 2019, Japan’s Government Pension Investment Fund, among the world’s largest, announced that it would halt stock lending, saying the practice is not in line with its goals as a long-term investor. They further cited a lack of transparency regarding the identity of the individuals or entities borrowing the loaned securities, as well as their motivations for borrowing.

This became a bigger concern for investors after the “cum-ex” scandal in Germany, where borrowed shares were allegedly used in a tax evasion scheme.

Voting Rights Transferred

Another one of the biggest criticisms of share lending is that shareholder voting rights attached to the actual stock are transferred to the borrower.

This practice challenges the traditional model, in which institutional investors vote and push for change in companies in order to maximize shareholder value for their investors. Money managers can recall shares in order to cast a vote in an upcoming shareholder meeting. But there are concerns that they don’t, and it’s unclear how often they do.

A Hidden Problem

Another concern is that share lending programs incentivize money managers to own stocks that are popular to borrow, but may underperform. A 2017 paper entitled “Distortions Caused By Lending Fee Retention,” updated in June 2023, found that mutual funds that practice securities lending tend to overweight high-fee stocks which then underperform versus funds that do not rent out shares.

Pros and Cons of Share Lending

There are numerous pros and cons to share lending.

Pros

The most obvious upside for investors is that they may be able to open up an additional revenue stream to increase their returns by lending their shares. Along the same lines, share lending can also help investors turn otherwise dormant investments into return-boosters, under the right circumstances.

Also, lending shares allows for investors to lend their shares to short-sellers – thereby greasing the wheels of the market and allowing short-sellers to do their work. It adds liquidity to the market, in other words.

Cons

One downside to share lending is that retail investors should take note that securities that have been loaned are not protected by the Securities Investor Protection Corporation (SIPC). The SIPC, however, does protect the cash collateral received for the loaned securities for up to $250,000.

There can also be negative tax consequences when lending out shares of stock. You don’t receive dividends for the stocks you’ve loaned out, but you do get Payment in Lieu that’s equal to the value of the dividends paid on loan shares. Unfortunately, though, these payments are taxed at your marginal tax rate, not the more favorable dividend rate.

Another concern is the increase in counterparty risk (similar to credit risk). Let’s say a short seller’s wager goes sour. If the shorted stock rallies enough, the short seller could default and there’s a risk that the collateral posted to the lender isn’t enough to cover the cost of the shares on loan.

Finally, there may be additional and special criteria that investors need to meet in order to qualify for share-lending programs. This will depend on individual brokerages or platforms, however. And a final note: If you use a platform that allows you to buy or trade fractional shares, those fractional shares may not be eligible for share lending, either.

thumb_up

Pros:

•   Potential to earn more revenue

•   Allows investors to boost returns from dormant investments

•   Adds liquidity to short-seller market

thumb_down

Cons:

•   Lack of SIPC protection

•   Increased counterparty risk (the borrower may default)

•   You’re taxed at the marginal rate on payments in lieu of dividends

•   Investors may need to qualify


Test your understanding of what you just read.


The Takeaway

Share lending or securities lending is a potential source of revenue for institutional investors and brokerage firms, who rent out shares that otherwise would have sat idly in portfolios. The practice has ramped up in recent years as management and brokerage fees have shrunk dramatically due to competition and the popularity of index investing.

There are pros and cons, however, as there’s always a risk that a borrower could default. That’s offset, naturally, by the chance to earn additional revenue and boost your ultimate returns. But there are no guarantees.

Invest in what matters most to you with SoFi Active Invest. In a self-directed account provided by SoFi Securities, you can trade stocks, exchange-traded funds (ETFs), mutual funds, alternative funds, options, and more — all while paying $0 commission on every trade. Other fees may apply. Whether you want to trade after-hours or manage your portfolio using real-time stock insights and analyst ratings, you can invest your way in SoFi's easy-to-use mobile app.

Opening and funding an Active Invest account gives you the opportunity to get up to $1,000 in the stock of your choice.¹

FAQ

What are the risks of share lending?

Some of the biggest risks of share lending are counterparty risk (or, the risk that a borrower will default and not be able to return your shares); the fact that you may lose SIPC protection on your shares; and that you may need to qualify in order to actually lend shares.

What exactly happens when you lend shares?

When you lend shares, ownership is temporarily transferred to a borrower, who transfers other shares or investments to the lender as collateral. The borrower also pays the lender a fee for the privilege of borrowing their shares.

Does share lending save money?

It doesn’t necessarily save money, but it can be a way to earn more money or drive more revenue from your owned investments. By lending out shares, you can garner fees from borrowers, amounting to a boost to your overall return.


INVESTMENTS ARE NOT FDIC INSURED • ARE NOT BANK GUARANTEED • MAY LOSE VALUE

SoFi Invest is a trade name used by SoFi Wealth LLC and SoFi Securities LLC offering investment products and services. Robo investing and advisory services are provided by SoFi Wealth LLC, an SEC-registered investment adviser. Brokerage and self-directed investing products offered through SoFi Securities LLC, Member FINRA/SIPC.

For disclosures on SoFi Invest platforms visit SoFi.com/legal. For a full listing of the fees associated with Sofi Invest please view our fee schedule.

Financial Tips & Strategies: The tips provided on this website are of a general nature and do not take into account your specific objectives, financial situation, and needs. You should always consider their appropriateness given your own circumstances.


¹Probability of Member receiving $1,000 is a probability of 0.026%; If you don’t make a selection in 45 days, you’ll no longer qualify for the promo. Customer must fund their account with a minimum of $50.00 to qualify. Probability percentage is subject to decrease. See full terms and conditions.

SOIN-Q125-027

Read more
TLS 1.2 Encrypted
Equal Housing Lender